The Centre works to improve wellbeing in the UK, and to reduce wellbeing inequalities. We do this using robust, relevant and accessible evidence to inform decision making. Underpinning that evidence there is a significant, and growing, data infrastructure for wellbeing in the UK that can, and is, being used to understand what government, businesses, communities and the public can do to improve wellbeing.
How can we use it?
Here we set out seven actions organisations can take to improve quality of life for people and their communities as they experience it. The seven actions fall under two categories: understand and act.
UNDERSTAND: Measure → Monitor → Research → Appraise → Evaluate
ACT: Inform → Policies & Projects
In this blog, I am focusing on the geeky data bit. On the other actions:
Evaluate: You nearly broke our website in February when we published the guidance on assessing wellbeing impact for small charities and social enterprises.
Appraise: And next month we’ll publish our guidance on appraisal following the recent changes to HM Treasury’s Green Book.
Policies and projects to improve wellbeing, both directly, and indirectly by designing in wellbeing drivers: A round up of the policies and projects that can improve wellbeing are here and in our evidence summaries.
Measure, monitor, research and inform
Use the growing wellbeing data infrastructure
In our recent guide to measuring wellbeing impact for small charities and social enterprises we set out a way to benchmark your results against a number of national datasets. These include personal wellbeing questions that help to understand the ways a large range of policies and life circumstances affect how we’re doing as individuals, communities, and as a nation.
Measure
You can add wellbeing questions and other relevant indicators to your surveys. You can also find other ways of measuring wellbeing in our Measuring Wellbeing discussion paper and ‘how-to’ series.
Monitor
Personal wellbeing data is reported quarterly by the Office for National Statistics. You can see the latest data and trends over time for the whole country and every local authority. These personal wellbeing measures are also included alongside available measures for the known drivers of wellbeing in the local area indicators for every local authority.
The personal wellbeing questions have been added to an increasing number of other data sets. This allows exploration in specific areas of interest, for example wellbeing of victims of crime or people taking part in sports or cultural activities.
Surveys using the four Office for National Statistics personal wellbeing questions
Longitudinal surveys that include subjective wellbeing measures and how they can be used to fill evidence gaps (Longview report comissioned by ONS).
There are starting to be welbeing measures in assessing performance, used in outcomes frameworks (Scotland Performs, Public Health) and Social Impact Bonds.
Let us know if you are aware of others!
Research
We have published guidance on analysing wellbeing data including information on Ordinary Least Squares Regression, by which we mean variables that are controlled for as standard (see sidebar).
Some examples of analysis of these datasets include:
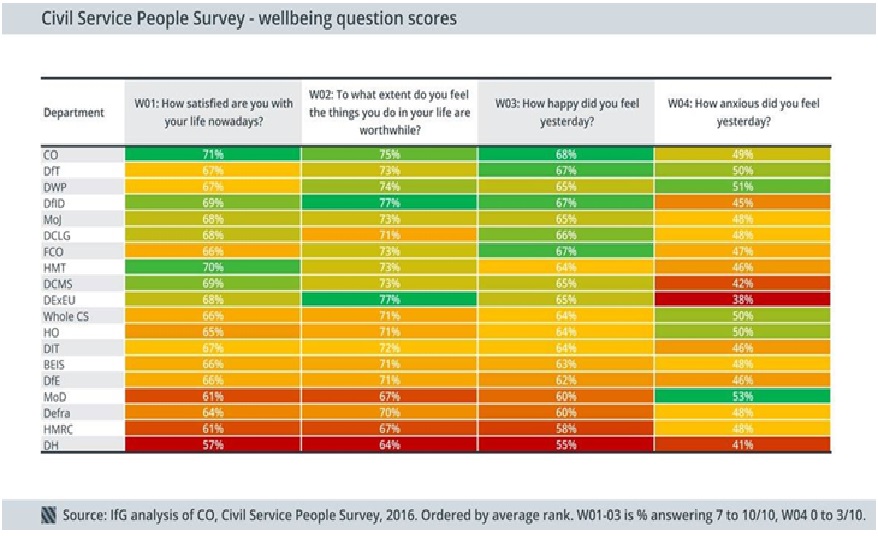
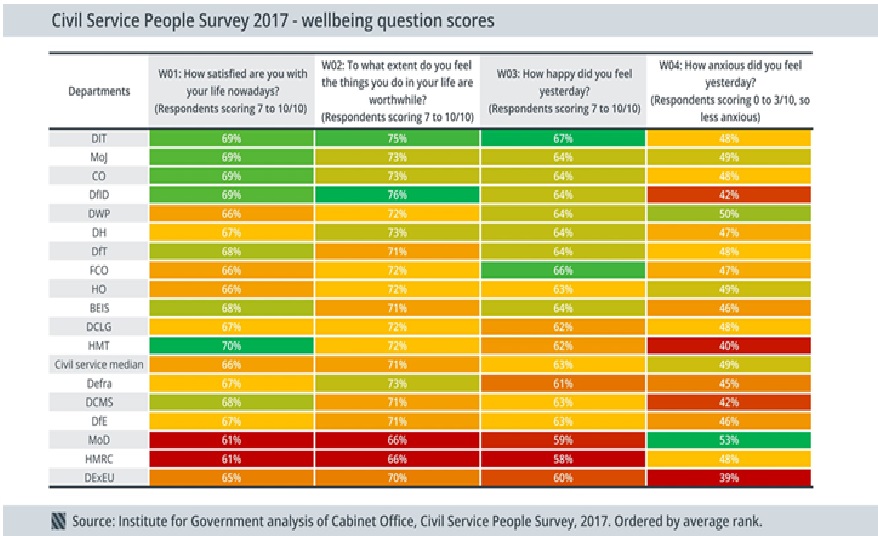
The personal wellbeing measures have been part of the Civil Service People Survey for some time. Here you can see wellbeing scores by department over the last two years (with thanks to @GavinFreeguard at the Institute for Government).
Inform
Releasing data and making it available in engaging formats makes it easy for a wide range of people, communities and organisations to use wellbeing evidence to inform their decision making.
This prototype app occupation data is an example of making the data available widely available and easy to use.
How are you using wellbeing data?
The Centre is always keen to hear from policymakers and practitioners about the ways you are analysing personal or social wellbeing data.
- Perhaps you have added some of the recommended wellbeing questions to your organisational or local area surveys?
- Or using the data in an outcomes framework or dashboard?
- Or doing something completely different?
Help us understand how wellbeing data is being used, you can get in touch via the comments section, email or tweet.
Ordinary Least Squares Regression – what to control for?
Differences in wellbeing between groups can sometimes be due to the different characteristics of people within the groups – age, gender etc. We often want to test whether, all other things being equal, wellbeing is different.
Ordinary Least Squares Regression allows for this. But what else should you control for?
Where possible try to control for:
• Health and Disability*
• Relationship Status
• Economic Activity/ Employment
• Income
• Age and Age Squared
• Gender
• Ethnicity
• Religion
• Highest Qualification level
• Dependent children
• Occupational Grouping/ Status
• Housing Tenure
• Interview type
• Region/ location
Interpreting the results of a regression does require some care. For example,if one finds that ethnicity no longer predicts wellbeing when controlling for income, there is no direct effect of ethnicity on wellbeing. However. it may still be the case that ethnicity plays a role in determining income which in turn determines wellbeing.