This week’s blog unpacks the data from the latest ONS release on personal wellbeing in the UK from April 2018 to March 2019. Dr Marta Moratti, interim Head of Evidence at the Centre, explores why personal wellbeing has held steady over the last year given the political climate we’re in.
Despite the political storm that has been playing out over the last year, the UK has mostly been getting on with working to improve life. It is also worth noting the data is based on household level data and therefore doesn’t include those in other types of home or none at all.
Some possible reasons may be:
- steady employment, higher minimum wages, and improvements in the quality of jobs in some sectors
- rising awareness about – and action on – mental health issues, although service provision may be patchy
- growing focus on loneliness, social connection, and community.
Issues remain and they are tough ones: regional disparities are big and long-standing, for example.
Key findings
The country overall
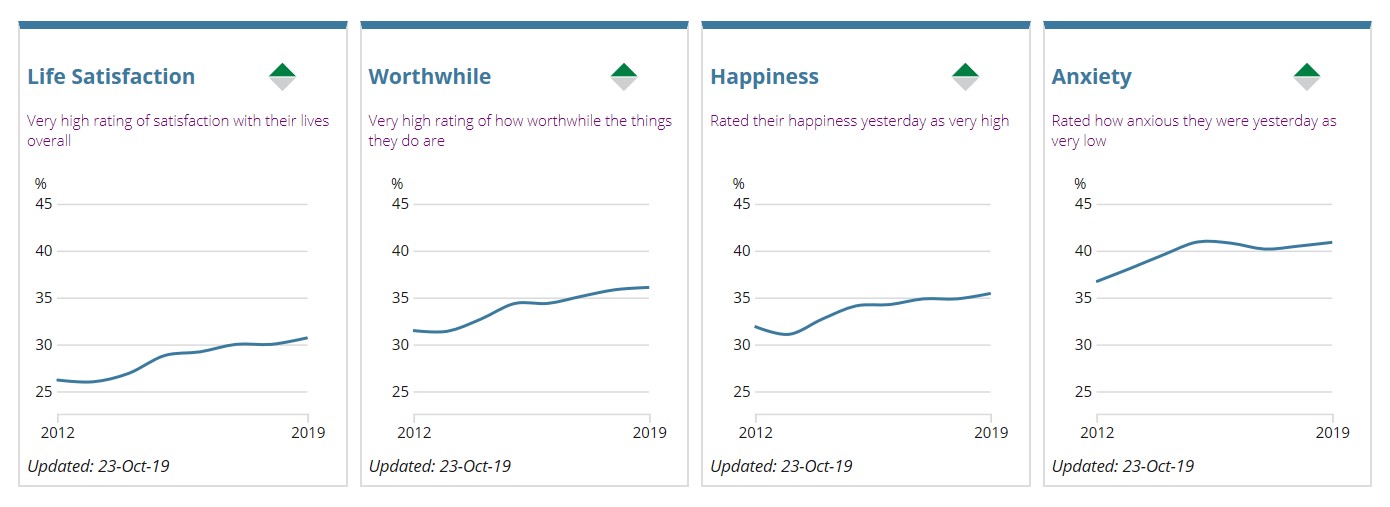
- Life satisfaction has increased from last year. Proportion of people reporting low and medium life satisfaction is lower.
- Average anxiety ratings in the UK improved between the years ending March 2013 and March 2019.
Look at data in your area: it’s important to look beyond the averages. Tools like Happy City’s Thriving Places, or the Centre’s report on wellbeing inequalities, help make sense of the factors in local areas.

Source: ONS wellbeing data 2019
Source: ONS dashboard 2019
How the regions differ
- Anxiety in Northern Ireland is up, moving more in line with the rest of the UK.
- Average life satisfaction has improved most in London over the last six years. But it remains the region with some of the lowest average life satisfaction in the UK. In the year ending March 2019, for example, Londoners reported scores of 7.58 out of 10, compared to the UK average of 7.71.
- Areas showing the biggest improvements in life satisfaction were those that typically reported some of the lowest wellbeing. Between the years ending March 2013 and March 2019. Compared with the 3.6% average increase in England:
- Harlow had the greatest average increase in life satisfaction at 14.4%,
- Fylde, Lancashire at 14.2%,
- North Warwickshire at 14.1%.
The ONS used Happy City’s Thriving Places Index to consider the local circumstances and how this might help understand the differences in personal wellbeing at local level. Take a look at the local level case studies.
- Anxiety has improved most in the North West region over the last six years. And within the UK, England is the only country to have seen a statistically significant improvement in anxiety ratings (5.6%) over this period.
This data is at local authority level. To measure wellbeing in your organisation or community:
Trust in government
- Trust in government continues a downward slide. It follows a peak in 2015, and the start of al downturn in Spring 2017. In 2019, 19% of respondents have trust in the Government. This is particularly for those in 35-54 age, the most miserable are also the most disappointed.
- This is backed up by the findings in the 2019 World Happiness Report that looked at the relationship between trust, voting behaviour, and government institutions and found that happier people are more likely to vote, and vote for the incumbent.
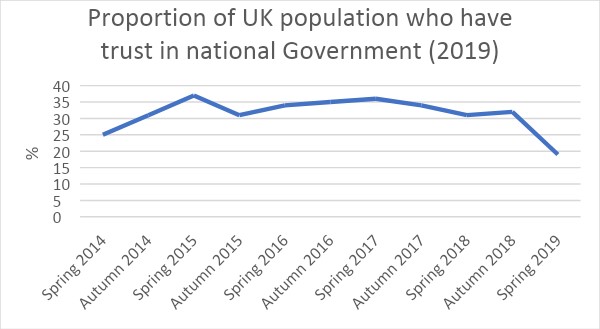
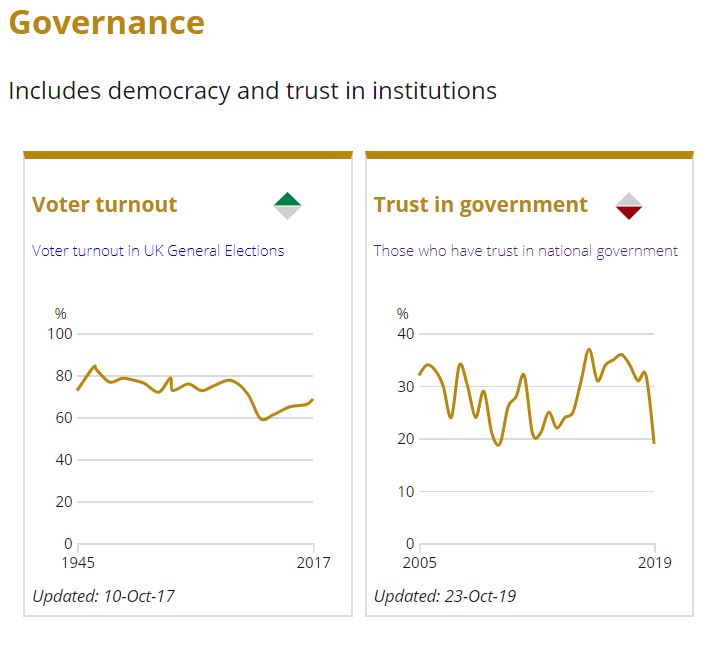
Source: ONS data 2019