Sector perspective: Local wellbeing indicators case study
This week’s guest blog is from Gareth Hooper, project manager at NHS Gloucestershire Clinical Commissioning Group. He shares how he and his team have been piloting the Centre’s Local Wellbeing Indicators, and what they have discovered in the process.
Download this sector perspective as a PDF
I reviewed the community wellbeing measures developed by the Centre and ONS from a Gloucestershire perspective. I asked five questions of the data:
1. What do the indicators show?
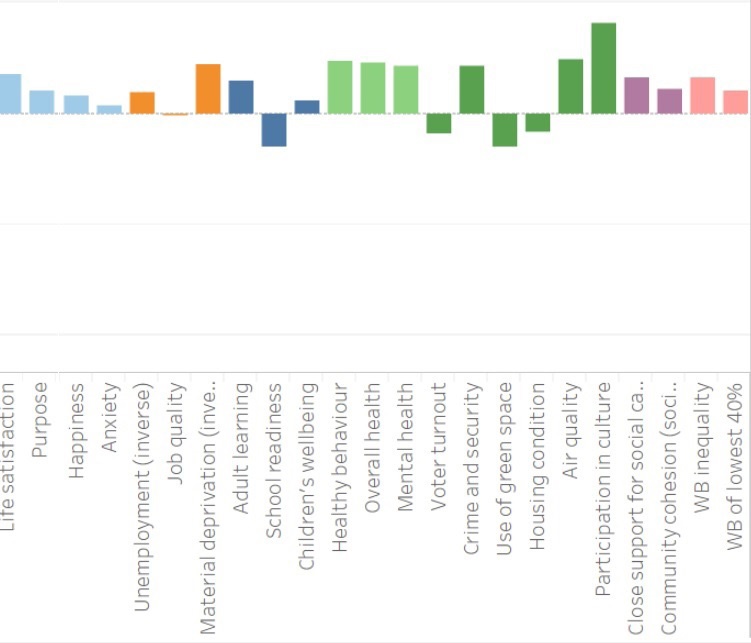
The mean line across all local authorities is running through the middle, which shows that Gloucestershire scores above the English average for 18 of the 23 indicators. Its best scores were in the Place and Health domains, specifically: participation in cultural activities (using the Heritage Lottery Fund RSA Heritage Index), air quality, physical activity, healthy life expectancy, mental health, and low levels of violent crime. Yet, despite being generally seen as an affluent rural idyll, Gloucestershire does score below average on some indicators – namely school readiness at end of reception, use of green space, voter turnout and housing conditions.
As a local practitioner, I was particularly interested in comparing Gloucestershire against similar areas. For example, whilst Gloucestershire does have quite similar scores to neighbouring Wiltshire, our neighbours do much better in terms of subjective wellbeing (both amongst adults and children), school readiness and participation in adult education. Conversely, we do a lot better in terms of cultural participation.
2. Does this make sense, given what we know about Gloucestershire?
When looking at data it is sometimes difficult to remove bias based on personal, anecdotal information. I was surprised that Gloucestershire, a rural and green county, had below average ‘use of natural environment.’ But maybe my bias (as someone who does enjoy the green spaces) has led me away from what the data says. We also know there are flaws with this data – it is showing those who use the natural environment for physical exercise, but others may use the natural environment for other reasons. An update of this indicators is planned, in discussion through MENE. I was also surprised Gloucestershire was below average for voter turnout. I felt it is a county well engaged with its politicians but perhaps I over-estimated this.
3. Do the metrics reflect life in a county that contains both the affluent Cotswolds as well as the pockets of deprivation, including those in cities?
Gloucestershire is made up of six District Councils with a mix of urban and rural areas. It’s inevitable that some of the differences between these two contexts are averaged out when creating a county-wide score. For example, whilst Gloucester’s crime rates are closer to the average for England, Gloucestershire overall does better than the English average – no doubt due to other parts of the county having much lower levels of crime.
Air pollution is generally confined to the urban areas of Gloucestershire: most notably Cheltenham, Gloucester and Tewkesbury. Air pollution being a function of traffic levels means that the rural county has low traffic density and reduces the effect of the urban areas.
Gloucester and Cheltenham are the two main urban areas and as such have high numbers of employment opportunities. Both areas have significant private and socially rented properties and a University with campuses in both Gloucester and Cheltenham. This is likely to affect social fragmentation compared to the more settled villages and towns in the county.
Disaggregating the effects of the rural and the urban contributions to the overall county value is difficult. A lot of data is held at a County level, but Gloucester has more volunteers per population than the county average. But Gloucester has a lower percentage of voter turnout. Gloucester has a lower proportion of poor housing. Maybe this is because of the level of enforcement of housing standards and investment in social housing.
4. Can agencies in Gloucestershire affect these drivers of wellbeing?
Being able to affect or respond to the metric is critical to their success, and I can see some challenges here. Metrics around material deprivation or social fragmentation may need third-party interventions or community solutions. I can see these measures may affect where community grants are directed. Some communities have less disposable income despite higher than average employment levels – it is important that these indicators are viewed together, when decisions are being made.
Another issue is that, amongst the indicators, I can see some such as ‘use of green space’ and ‘poor housing’ are related to policy areas that are District Council led, whilst others, such as ‘school readiness’ and ‘violent crime’, are led by County-wide organisations. Where District Councils lead, it’s likely they would want district level data. Both so that they know the data within their jurisdiction, but also so that any improvements they make won’t be lost by being averaged over a larger county-wide population.
5. What next?
As mentioned before, district-level data would be of great help in engaging District Councils. Having said that, I don’t see much need in drilling down further. The indicators used here feel that they are best represented at a relatively broad level – for example drilling down to Lower Super Output Areas does not feel necessary. (Lower Super Output Areas are small geographical areas defined for official statistics. There are 529 Lower Super Output Areas in Gloucestershire.)
I think the indicators will challenge system wide thinking and resource allocation at a time of stretched resources. Some indicators, for example around social fragmentation and job quality, pose big questions for local authorities. With no obvious direct influence in these areas, their engagement on these issues will probably come down to how up for the challenge the local agencies are, and the existence of bodies that are set up to think holistically about local issues. For example, in Gloucestershire we are fortunate to have several learning sites for Asset Based Community Development (ABCD). This is a multi-agency project, with a huge amount of collaboration, working alongside communities. I hope the data in the Local Indicators Project will be of use to them.
In Gloucestershire at least, this set of indicators will be considered and I am certain that they will influence what we do.
Overall conclusions
Overall I like this set of indicators. I like how it is presented with an average line running through it so that I can see what needs my attention and what things I can maybe de-prioritise. I like the choice of the metrics as they appear to reflect what in my experience matters to people. I particularly like the subjective wellbeing questions at the end. For me these are a reminder of what the outcomes of wellbeing policy should be. But maybe the conversations the metrics will generate are just as useful. This makes the data not just a measure of outcomes, but a catalyst for new areas of work.