Wellbeing and employment: While working is good for wellbeing, retiring is better
Downloads

Wellbeing and employment: While working is good for wellbeing, retiring is better.
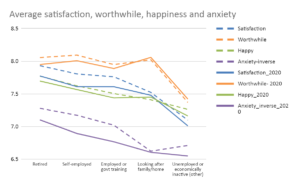
We know that being unemployed can be bad for wellbeing. People that are unemployed are on average unhappier, with a lower sense of purpose, lower life satisfaction and higher anxiety than people who are employed. The size of this unemployment penalty has been decreasing over the past decade, however during 2020, the gap between the average wellbeing of people unemployed and employed has increased compared with pre-pandemic levels. This could be due to the low wellbeing of people becoming newly unemployed during this time, or a deterioration in the wellbeing of people that have remained unemployed.
Meanwhile, people who have retired from work are happier than those employed, with higher life satisfaction and lower anxiety. This relationship holds after controlling for other factors such as age.
People that are self employed, also generally have higher life satisfaction, happiness and worthwhile than those that are employed. However, in 2020, the regression analysis controlling for other factors found that self employed people became marginally less satisfied and more anxious relative to employed people.
People that look after the family/home, have relatively low levels of life satisfaction and high anxiety. This relationship holds for life satisfaction after controlling for other variables. However, they are no less happy and also have a higher sense of purpose. In 2020, as the Covid pandemic and everyone’s wellbeing took a hit, people looking after family/home as their main work saw a much lower worsening of anxiety and life satisfaction relative to employed people.

This analysis is based on data from the UK’s ONS’ Annual Population Survey.
The four subjective wellbeing questions included in the annual population survey ask people to report on a scale of 0-10
-
Overall, how satisfied are you with your life nowadays?
-
Overall, to what extent do you feel that the things you do in your life are worthwhile?
-
Overall, how happy did you feel yesterday?
-
Overall, how anxious did you feel yesterday?
Dashed lines in the chart represent data from March 2019 – March 2020. Solid lines is data collected April – September 2020, during the Covid-19 pandemic.
Downloads
![]()
[gravityform id=1 title=true description=true ajax=true tabindex=49]

