Measuring wellbeing inequalities and progress in reducing them
This week has seen the publication of the World Happiness Report and the launch of Lives Cut Short, the public awareness campaign by Health Equals, bringing inequalities to the forefront of national and global conversations.
Measures of inequality help us to explore differences in wellbeing between and within different groups in society. Income and health inequalities have well-established measurement and evaluation approaches.
In our latest methods series discussion paper, published today, we discuss whether we can reach a similar consensus for subjective wellbeing. To do this we explore the challenges and opportunities, introducing four possible approaches to measurement.
The 11th World Happiness Report sets out wellbeing inequality trends by country, region, and the world as a whole. It also looks at benevolence – helping each other and peer support – and new data on social connections and loneliness.
“This is where we need to go back to our definition of success and insist that our real objective must be increasing wellbeing and reducing inequality in wellbeing.” – Lord Gus O’Donnell, Former Cabinet Secretary
The approach to measuring wellbeing inequality in this year’s report looks at trends in the distribution of wellbeing, by calculating trends in the variables separately for the more and less happy halves of each national population, giving a ‘happiness gap’ size.
They find:
- This ‘happiness gap’ is small in countries where most people are happy but also in those countries where almost no-one is happy. However, more generally, people are happier living in countries where the happiness gap is smaller.
- Happiness gaps globally have been fairly stable over time, although there are growing gaps in many African countries.
Here, we look at ways to measure wellbeing inequality.
What is wellbeing inequality and why measure it?
Wellbeing inequality can be understood as the extent to which people’s experiences of life vary.
Identifying these differences can help policymakers target those in most need, closing the gap between those who are thriving and those who are struggling by reducing inequalities and increasing wellbeing.
This is the aim of the UK government’s Levelling Up programme.
While there are often large differences, these are not inevitable, suggesting that policy could aim to reduce or eliminate inequalities.
What are the current challenges?
We know that, outside of London’s financial industry, we have areas of the country with more potential than is being realised. Deprivation, median income and unemployment are all associated with higher wellbeing inequality at the local authority level. And, although more rural areas have higher average wellbeing, this doesn’t translate into lower wellbeing inequality.
So, while headline GDP is a useful indicator of overall national progress, it does not capture the reality of the wellbeing inequality in the UK. Neither do averages, which is why wellbeing research and policy cannot rely solely on evidence evaluated at the mean.
In order to fulfil public policy ambitions, we need ways to accurately and consistently measure inequalities, track progress, and assess success that goes beyond the headline of national GDP.
Using a wellbeing lens – and exploring local-area insights – provides richer information than a focus on income or health inequality alone. Additionally, as the determinants of health are also key drivers of wellbeing, it makes sense to embed wellbeing at the heart of policy making and evaluation in order to effect positive national change.
While progress has been made since we published our 2017 report on measuring wellbeing inequality in Britain, questions remain about how best to measure and communicate these insights.
Discussion paper: Thoughts on wellbeing inequalities
The purpose of our newly published paper is to spur discussion about how best we might measure inequalities in wellbeing in a way that reflects the lived experience of people in society, and which allows useful comparisons to be made across groups of people and across time.
The authors discuss a number of challenges in attempting to produce a metric (or metrics) of wellbeing inequality:
- Subjectivity
- Scale
- Differences in severity
- Censoring
- Discreteness
These challenges, however, are not as severe as they might initially seem. There are also, the authors highlight, limitations of income metrics including:
- Diminishing marginal returns; the more of something you have, the less valuable each new unit is in terms of the utility it provides.
- Making things look the same which are not.
- Missing out on structural and social factors.
Having set this context, the authors then introduce four different possible ways to measure inequalities in subjective wellbeing:
- Standard deviation
- Ratio of Low/ High
- Gini Coefficient
- Shannon Index
The discussion paper uses publicly available data on regions of the United Kingdom to allow for side-by-side comparisons of the scores and the rankings the four models produce (outlined in tables 1 & 2).
Table 1: UK regional inequality scores
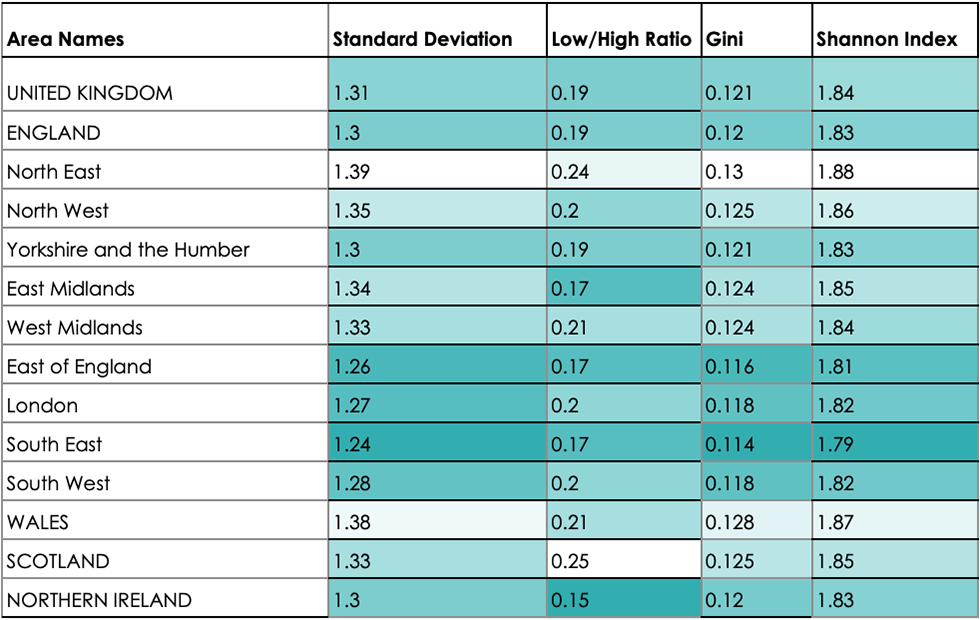
UK regional inequality scores. Source: Thinking about wellbeing inequality discussion paper
Table 2: UK area rankings for each metric
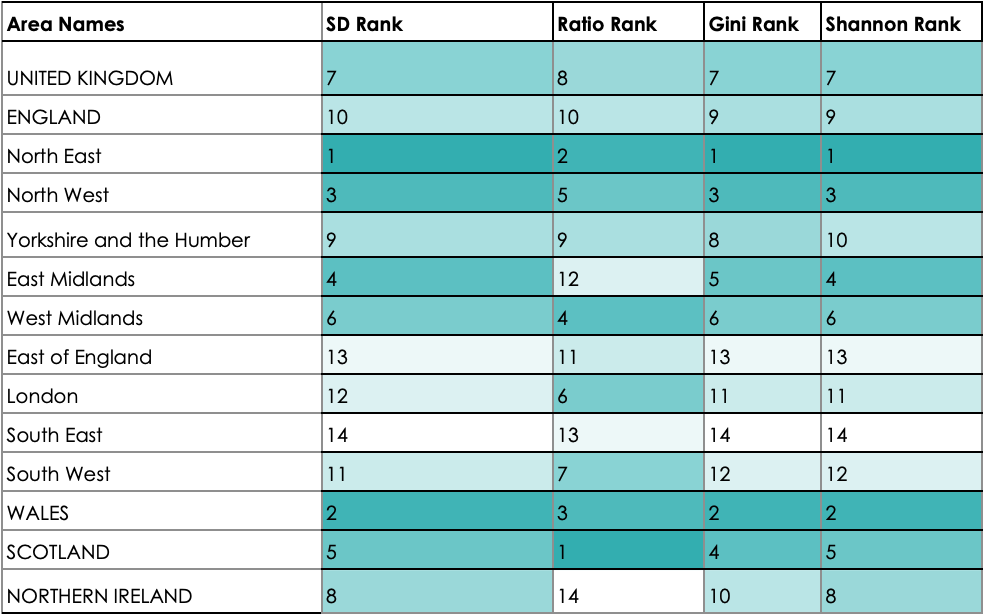
UK area rankings for each metric. Source: Thinking about wellbeing inequality discussion paper
The Standard Deviation, Gini Coefficient, and Shannon Index produce very similar rankings of regions. The ratio approach produces results that are fairly well correlated with the other scores, albeit less so than the other three.
Read the discussion paper in full.
What’s next?
We welcome comments that emerge from this paper. Please get in touch with us at info@whatworkswellbeing.org to share your thoughts.
We will be continuing the development of measures of wellbeing inequalities in the months to come, including updated analysis on wellbeing inequality in Britain.
Please note: This blog has been updated after clarifying regional codes in the dataset (29 March 2023)
Blog
![]()
[gravityform id=1 title=true description=true ajax=true tabindex=49]