Beyond the averages: higher education and wellbeing
Downloads

The quick read
If we evaluate the link between education and wellbeing at the average, we can lose important nuances that matter for strong, representative policy.
This is because the relationship is different at different levels of life satisfaction.
This research is a UK-first to investigate the relationship between wellbeing and higher education on such a large dataset. It uses a combination of cross-sectional, panel and event analyses.
The research found that:
- for those with low life satisfaction, higher education is important and can act as a positive buffer against
negative shocks; - for those with mid-level life satisfaction, higher education has no statistically significant impact;
- for those with high life satisfaction, higher education is important as a positional good, but can have a negative association leading to ‘frustrated achievers’;
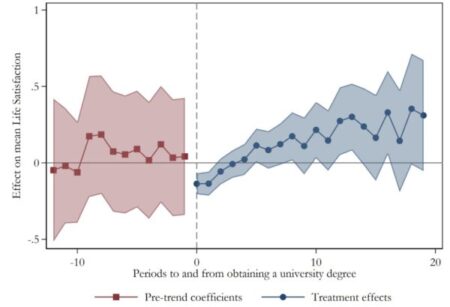
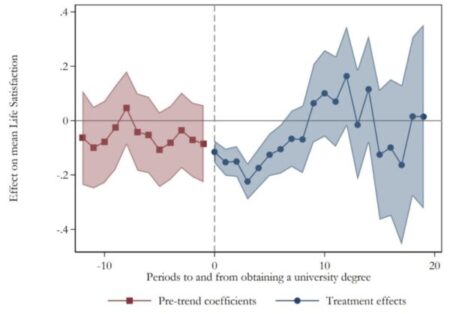
- getting a university degree initially decreases life satisfaction, but ultimately improves it over time.
Frustrated achievers are people who experience negative wellbeing due to unmet aspirations. No matter how much you have achieved, you feel you need more in order to be happy. (Graham and Pettinato, 2002)
Background
Education and wellbeing
Previous research has found that areas in the UK with lower educational levels are at risk of lower subjective wellbeing. This strong positive effect of education at a national level can be explained because education increases income and is a positional good.
But this positive relationship is not usually observed at a local geographical level. When using wellbeing data from a local authority level, education seems a poor predictor of individual wellbeing.
With ‘education’ appearing 139 times in the UK government’s Levelling Up White Paper, understanding how education and wellbeing interplay is crucial to the success of the programme.
What was done
The study
The study looked at the effects of having a university degree on populations who report high versus low levels of life
satisfaction.
To do this, secondary data from two UK datasets was analysed:
1. Waves 1-5 of the Community Life Survey (2012-2017).
This is a nationally representative repeated cross-section of respondents in England. It contains questions on engagement in social and local activities, as well as demographic and socio-economic characteristics. It enabled us to examine geographic variation in life satisfaction by using Output Area categories in which respondents live. The full sample included approximately 19,500 observations.
2. The British Household Panel Survey (1991-2009)/ Understanding Society (2009-2019).
These are representative surveys of the United Kingdom at the individual and household level. Using all available waves allowed us to follow individuals over time, including before and after obtaining a university degree. The broadest sample used included approximately 525,500 observations and about 90,000 unique individuals. This included 28 waves in total and excluded post-December 2019 due to the pandemic period.
Measures and analysis
Life satisfaction is self-reported on a 0-10 scale. For this analysis, scores 0-4 were categorised as ‘low’, 5-8 as ‘middle’ and 9-10 as ‘high’. This differs from ONS recommended banding (low 0-4, middle 5-6, high 7-8, very high 9-10).
Education was defined here as having a first university degree and above and treated as a binary variable.
Data was analysed:
- Cross-sectionally, using Ordinary Least Squares and quantile regression.
- Longitudinally, using a linear panel study.
- Geographically, using Output Areas from the Community Life Survey.
Depending on the model, we controlled for age, gender, marital status, social capital, health, year and interview mode.
A statistical analysis that allows us to control for socio-deomographic factors such as age, gender etc. so we can test whether, all things being equal, wellbeing is different within different groups. It can calculate wellbeing scores taking into account the effects of other factors.
What did the study find?
The analysis of cross-sectional data showed that:
- at the mean, the relationship between higher education and life satisfaction is small or close to zero;
- at low levels of life satisfaction (scores 0-4) the relationship is larger and positive;
- at high levels of life satisfaction (scores 9-10) the relationship is negative.
The analysis of longitudinal data showed that:
- having a degree is associated with different trajectories in life satisfaction over time;
- individuals who start with lower life satisfaction in younger age [figure 1] benefit more from education than those with higher life satisfaction [figure 2].

Figure 1. Dynamic effects of obtaining a degree for those with life satisfaction below 6 between age 15 and 22

Figure 2. Dynamic effects of obtaining a degree for those with life satisfaction above 5 between age 15 and 22
The analysis of geographical data showed that:
- deprived areas have the lowest shares of individuals with degrees.
Overall, the findings indicate:
- the relationship between higher education and wellbeing is not constant;
- education can be predictive at smaller geographical or individual levels when the sample is split between
those with low, middle or high life satisfaction; - as education is associated with access to resources, and these tend to be concentrated spatially, there will be a geographical gradient in the relationship between education and life satisfaction.
A possible theoretical foundation for the results is ‘homeostasis wellbeing theory’. This is the notion that
individuals’ wellbeing has a tendency to revert to a set-point range through the action of a set of buffers.
Shocks (such as divorce, illness or job loss) may temporarily increase or decrease wellbeing, individuals typically adapt to them.
Education can act as an important buffer for those with low wellbeing by opening up different life trajectories through access to resources. That in turn can lead to access to different geographical areas.
Education is less relevant for those with high wellbeing who are at lower risk of external shocks, for example because their job is more secure.
Research implications
This research demonstrates the need to focus on the tails of the distribution rather than the average effect, as aggregate results can hide nuances without telling us what to change.
The focus is often placed on national level data, but people’s wellbeing varies considerably across the UK.
The data reveals that the relationship between education and wellbeing varies across types of place (such as cosmopolitan, rural, and hard-pressed living) and across the life satisfaction spectrum.
Policies in both education and wellbeing need to be sensitive to these nuances. There is no ‘one size fits all’ option.
Recommendations for action
For researchers
The quantitative analysis of survey data using ONS4 measures represents a good approach. To further understand what drives wellbeing for different segments of the population, and to inform strong and representative wellbeing policy, we also need different kinds of information and methodologies.
Here are some of the identified challenges and accompanying suggestions for future research:
Challenge | Suggestion |
---|---|
Our findings are limited to the UK. | Explore wider data sets to understand global nuances. |
Different urban, suburban and country areas are likely to have different underlying distributions of life satisfaction. |
Consider contextual and place-based factors when examining the effect of education. |
We are assuming that the interpersonal and intertemporal (for a same individual) comparisons in life satisfaction are valid, in the sense that they are based on the same scale. | Further explore if this is the case or whether different individuals might attach different meanings to the points on a life satisfaction scale, or because, for asame person, such meaning may change over time. |
Our findings only considered education as ‘having a degree’. | Explore variations in education attainment and delivery to further understand the effects of education on life satisfaction. |
For policymakers and practitioners
Challenge | Suggestion |
---|---|
Micro-level results not aligning with macro-level findings | Interpret findings at both micro and macro level, so you are not relying on macro-level data alone. |
Fulfilling levelling up missions | Recognise the role of education at different life satisfaction levels and in geographical areas. |
Narrowing inequalities | Create and deliver targeted education and skills training opportunities for potentially bigger wellbeing boosts. |
References
Graham, C. L., & Pettinato, S. (2002). Happiness and hardship: Opportunity and insecurity in new market economies. Brookings Institution Press.
Hirsch, F. (1976). Social Limits to Growth (pp. 1-12). Cambridge, MA and London, England: Harvard University Press, 2013 edition.
Suggested citation
Felici, M., Agarwala, M., 2022. Beyond the averages: the importance of education for wellbeing [online] What Works Centre for Wellbeing, available at: https://whatworkswellbeing.org/resources/beyond-the-averages/
Downloads
You may also wish to read the blog article on this document.
Downloads
You may also wish to read the blog article on this document.
[gravityform id=1 title=true description=true ajax=true tabindex=49]