Civil Service wellbeing over time: exploring data from the Civil Service People Survey 2014-21
Downloads
About the paper
Employee wellbeing is an important concern for employers. An unhappy and unmotivated workforce is likely to experience greater absence, turnover, and lower productivity than one that has higher wellbeing.
Collecting and analysing workplace wellbeing data provides an insight into how staff wellbeing is affected across organisations and type of work, over time, and in the context of the wider world.
Through the Civil Service People Survey, the UK government has collected wellbeing data in the civil service with results available from as far back as 2014. This provides valuable insight into employee wellbeing in different government organisations before, during and through recovery from the pandemic.
In this short paper, we consider:
- How civil service wellbeing has changed through the pandemic, and since the survey started;
- Whether the experience of the pandemic has been the same across the civil service, and;
- Whether civil service wellbeing has recovered from the pandemic, and and how different departments are affected.
Changes through the pandemic
Our first analysis looks at how wellbeing has changed over the last few years. The pandemic is likely to have had a major impact on the subjective wellbeing of civil service employees, as it has across the nation as a whole. We also expect 2021 to be different to 2020, and potentially different to pre-pandemic trends as well.
This dataset is valuable not just for understanding wellbeing in the civil service, but also across the country; not necessarily because civil service wellbeing is representative, but because the response rate for the civil service people survey is high, compared to many other surveys.
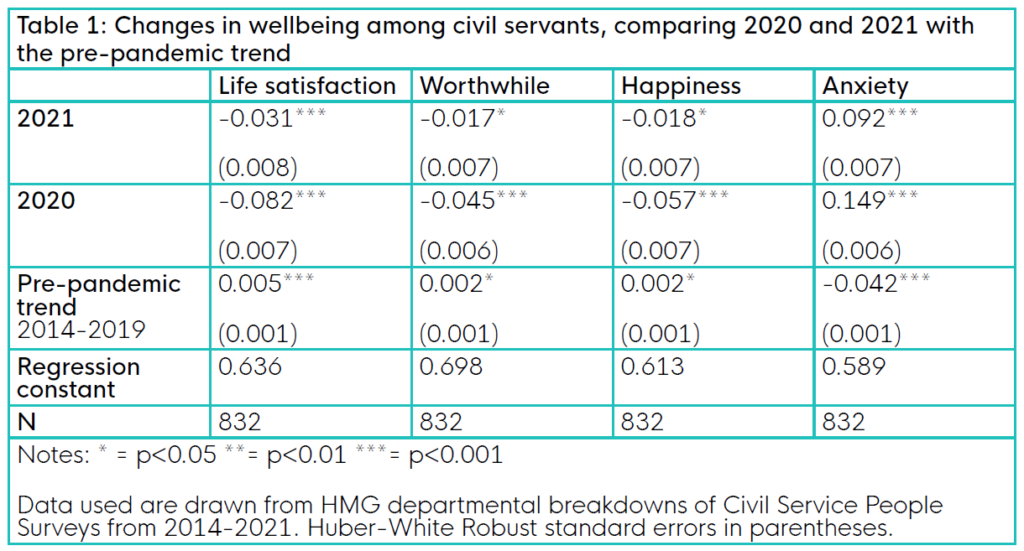
To investigate both the overall trends and the two ‘outlier’ years of 2020 and 2021, we conduct a basic linear regression analysis, in which departmental wellbeing is regressed on a pre-pandemic trend, and in which 2020 and 2021 appear separately as binary indicators for those years.
Through this analysis, we are able to compare the average proportion of people scoring highly on the four wellbeing questions asked in the civil service people survey. For the first three of these indicators (life satisfaction, worthwhile and happiness), a higher score is better, while for anxiety, it is worse. The results of a straightforward OLS regression made on these data can be found below.
P values denote whether the difference between two numbers is ‘statistically significant’. They relate to the confidence with which we are able to reject the null hypothesis of no effect. In the regression results shown above, this denotes whether the value attached to a variable (for example, the trend) is significantly different from zero.
If the difference is statistically significant, for example at the p<0.05 level, denoted by a single *, then we are 95% confident that the number is greater than 0.
In the case of the trend in life satisfaction, we see that life satisfaction is rising over time. The point estimate is 0.005, and this is statistically significant at p<0.001. This does not tell us how likely 0.005 is to be the correct value – instead, it only confirms that we are confident that the trend is in an upward direction.
The analysis indicates positive wellbeing trends pre-pandemic, with:
- The proportion of civil servants with high life satisfaction rising by 0.5% point per year.
- The proportion with high happiness and worthwhile scores rising by 0.2% points per year.
- The level of anxiety falling on average by 4.2% per year.
These trends are slower than we observe in the general population (see for example our recent paper on wellbeing trends across local authorities), but are nonetheless encouraging.
The pandemic has overturned these trends. In 2020:
- Life satisfaction fell by 8.2% points, overturning the equivalent of 16 years at pre-pandemic trends.
- Worthwhile and happiness experienced smaller percentage points drops (4.5% point and 5.7% point respectively), but due to the slower pre-pandemic growth, this is the equivalent of more than 20 years progress for those measures.
- Anxiety experienced the largest change, rising by 14.2% points in 2020.
For 2021, all four wellbeing indicators were significantly worse than pre-pandemic levels, but significantly better than 2020 levels:
- For life satisfaction, worthwhile and happiness, approximately two thirds of the proportion of high wellbeing lost in 2020 is recovered by 2021.
- For anxiety, recovery has been slower. Around a third of the proportion of the 2020 increase in high anxiety has been recovered by 2021.
We can now look at these data graphically to help us to evaluate the changes compared to prior trends. This panel data is not balanced – there are fewer departments’ data earlier in the time series, and some departments move in and out of measurement (one prominent example is the Test and Trace service, which for obvious reasons first appears in 2020).
The graphs below show averages across all departments reporting (without weighting for department size), from 2014-2021. As with the regression results, there is a clear trend – things got substantially worse in 2020 – reaching their worst level on record for 3 of the 4 indicators, but we see substantial average recovery in 2021.

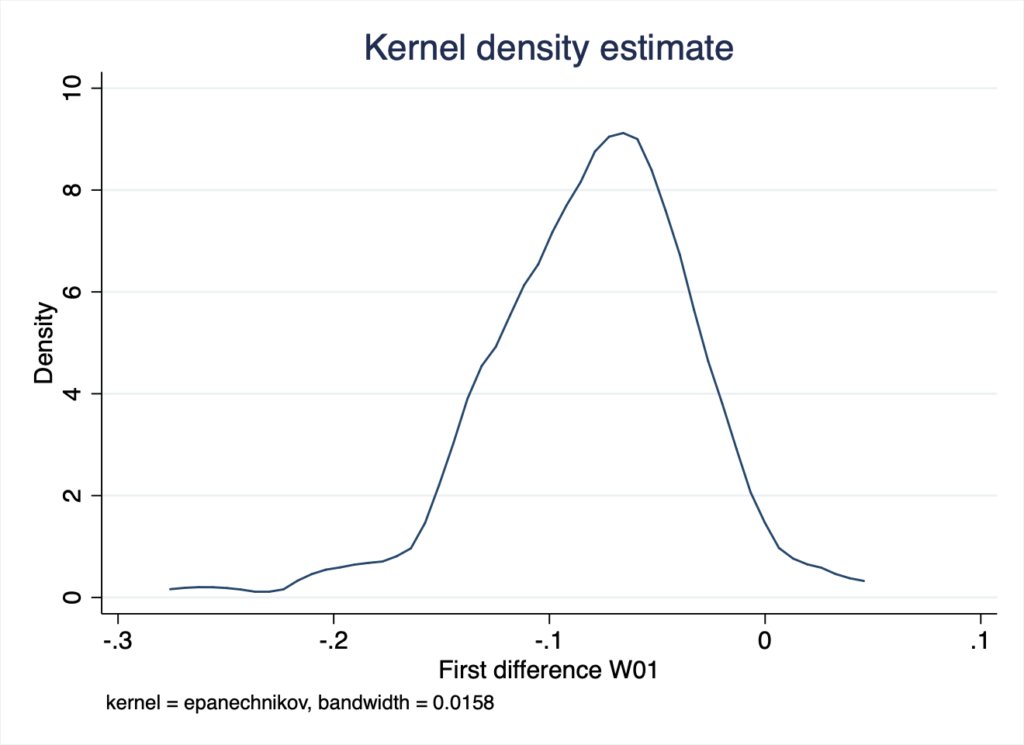
Figure 1: Changes in proportion of civil servants with high life satisfaction (W01) over time
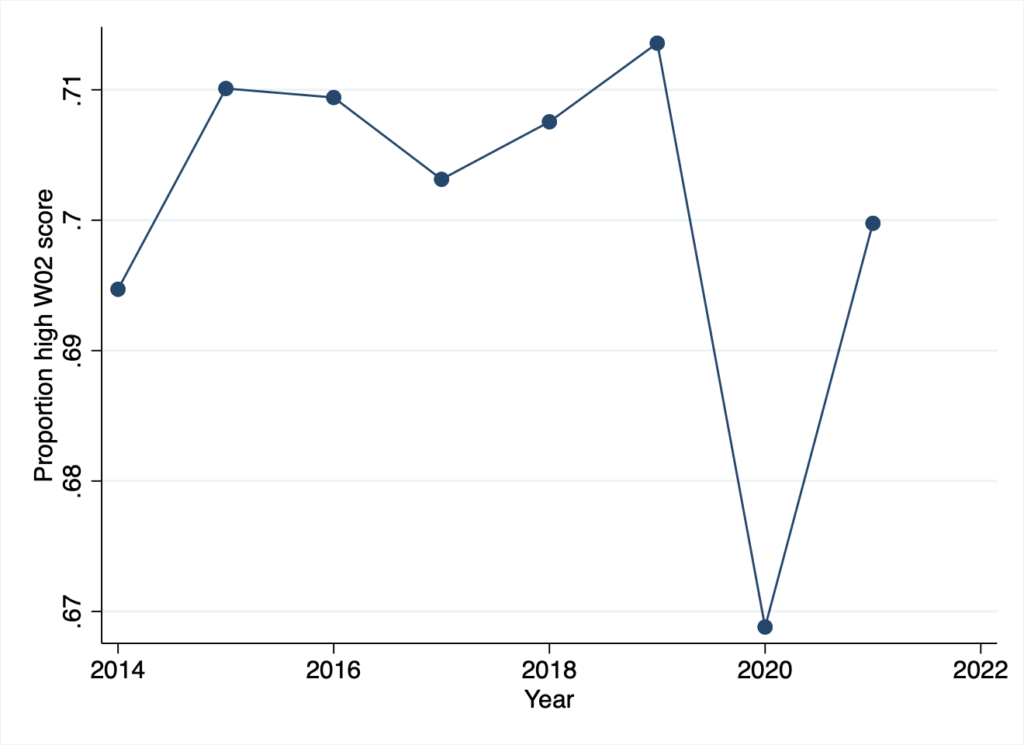
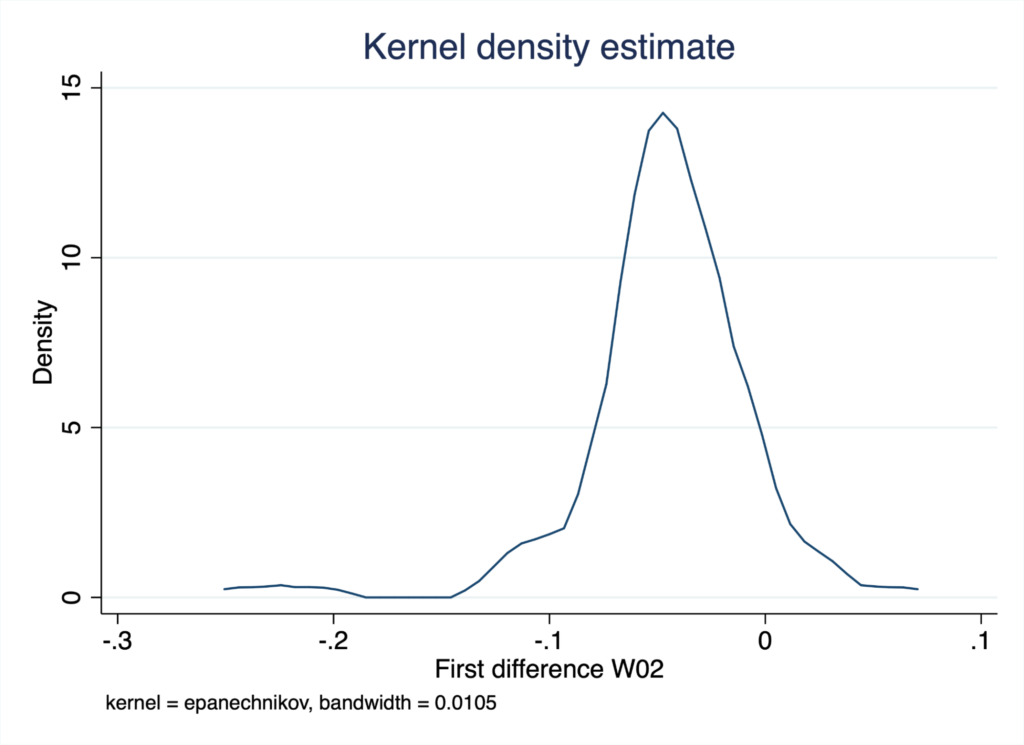
Figure 2: Changes in proportion of civil servants with high worthwhile (W02) over time

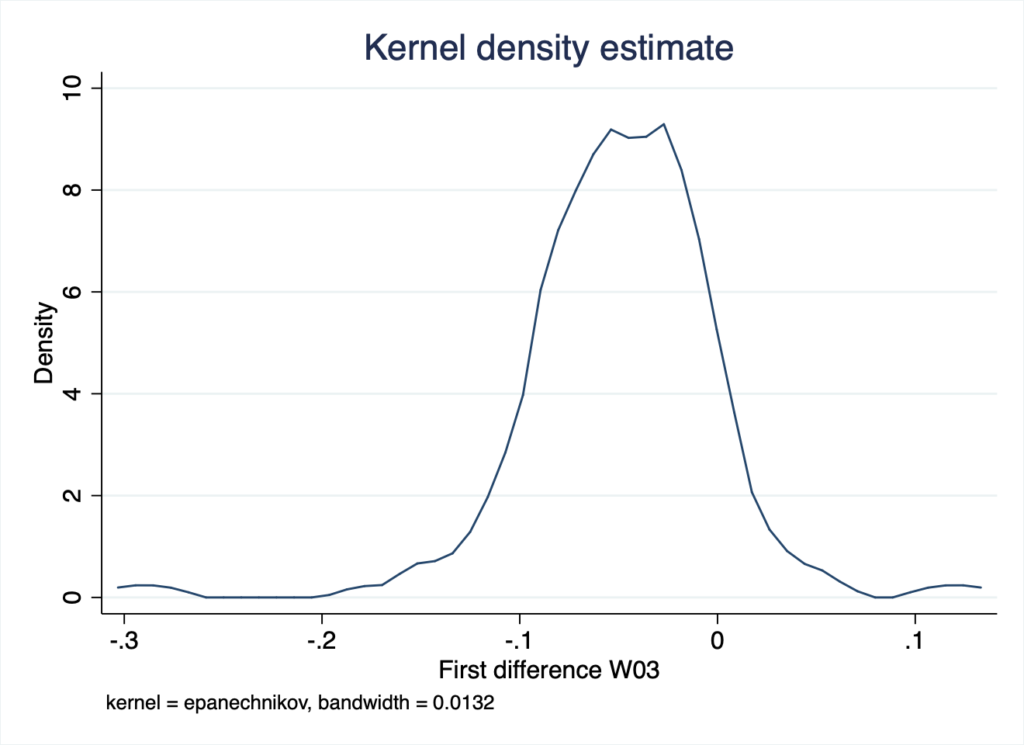
Figure 3: Changes in proportion of civil servants with high happiness (W03) over time
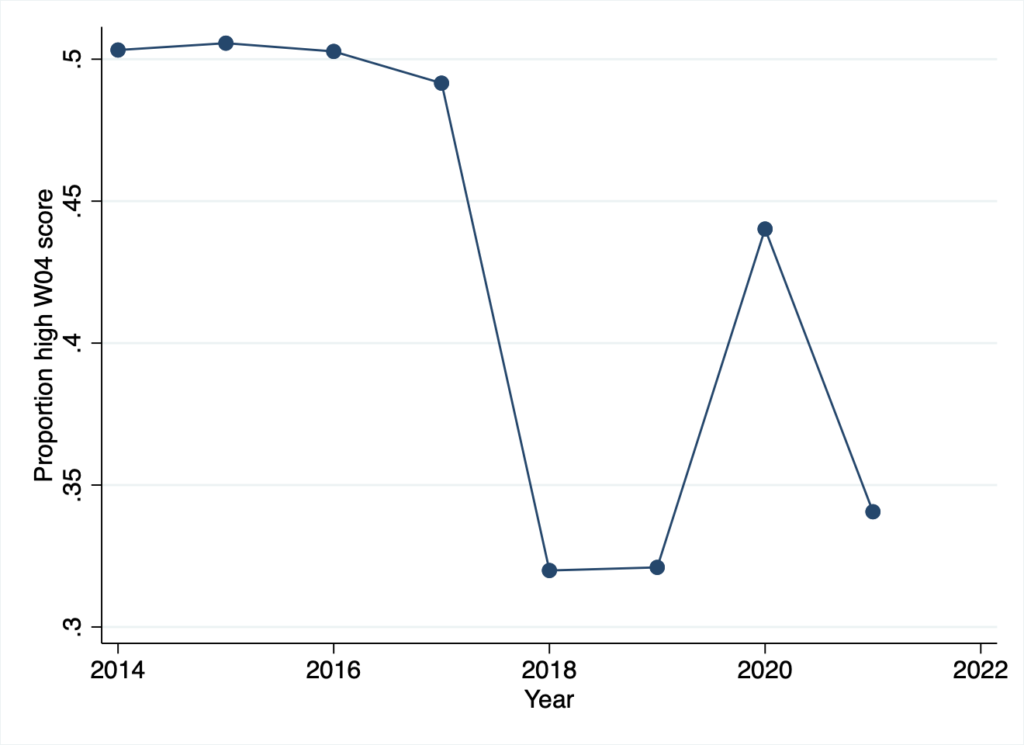
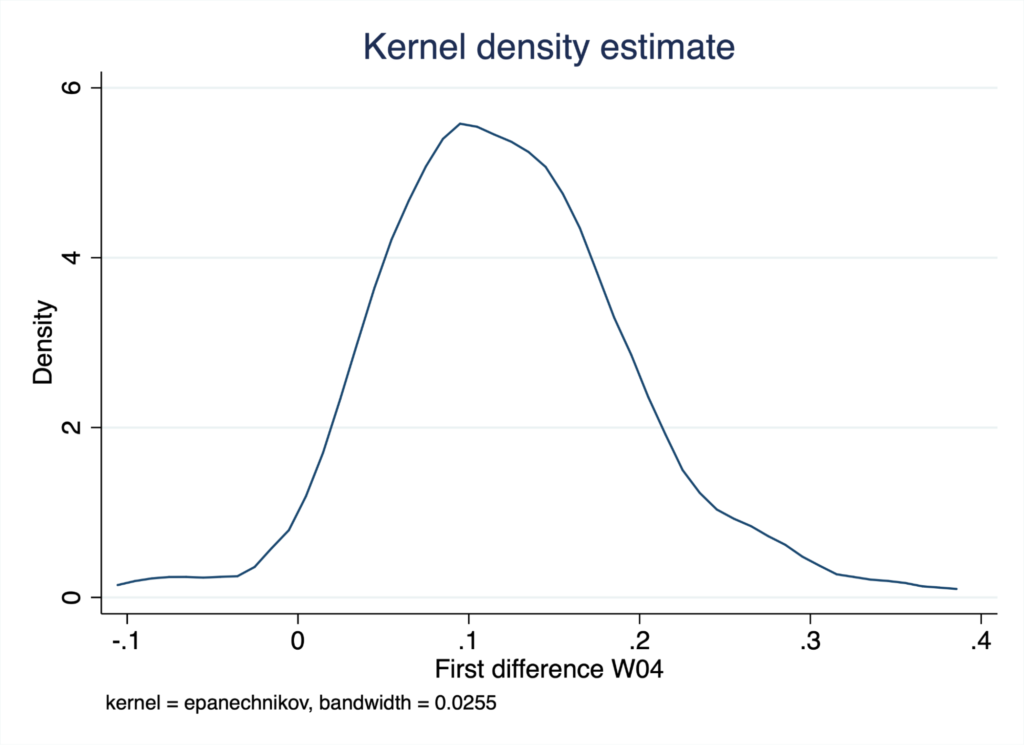
Figure 4: Changes in proportion of civil servants with high anxiety (W04) over time
Were changes uniform?
On average, the civil service has experienced declines in wellbeing over the pandemic. We want to understand if these are uniform, or whether activities of specific departments had a greater or worse impact on wellbeing and recovery. This could shed insight on how to manage recovery more broadly.
To do this, we establish an unbalanced panel within our data, and look at changes within the same cluster over time. We take the first difference of each of our measures, between 2019 and 2020 – that is, how much the scores change for these four measures in that cluster over that twelve months. These are then mapped in kernel density plots, which can be found below.
The results show a central tendency towards worsening situations. However, there is some measure of spread, with each of the values having some values that fall on the other side of the origin to the central tendency. Different measures have different levels of spread. Only the results of question W04 (anxiety), do not exhibit significant levels of skewness and kurtosis compared to the normal distribution.
A kernel density plot maps the distribution of a numeric variable using a continuous curve. For any given value on the variable (shown on the x axis), the height of the graph shows the density of the distribution at that point.
Where the y axis value is high, there are lots of people around values of the variable. Where the y axis value is low there are fewer people around values of the variable. Where the y axis is twice as high at some value than it is around some other value, that means there’s about twice as many people with the first value than the second.
The area under the curve sums to 1, and so we can derive the proportion of people with values of the variables between x1 and x2, as the integrand of the curve between x1 and x2.
Another, more binary indicator of experiences across departments is to consider how many clusters have negative first differences on all of the measures, and how many have positive first differences on all of the measures.
90 clusters, of 105 for which first differences can be calculated, have negative first differences across all four measures. No clusters have positive first differences scores across all four questions. Relaxing this condition to three positive first differences – only one, the Veterinary Medicines Directorate, makes the cut. This means that the people working at the Veterinary Medicines Directorate experienced increases in wellbeing during pandemic on three measures (all but anxiety), and is the only department to do so.
Levels of change in wellbeing
On average, the pandemic was negative for civil service wellbeing. However, as seen in the kernel plots, there was substantial heterogeneity across departments indicating that changes in wellbeing are not uniform.
Therefore, it is helpful to ask: which departments experienced the biggest drops in each measure; which experienced the smallest drops in each measure, and which have bounced back the quickest in 2021. The next three tables report the ‘top ten’ departments for each of these four wellbeing measures.
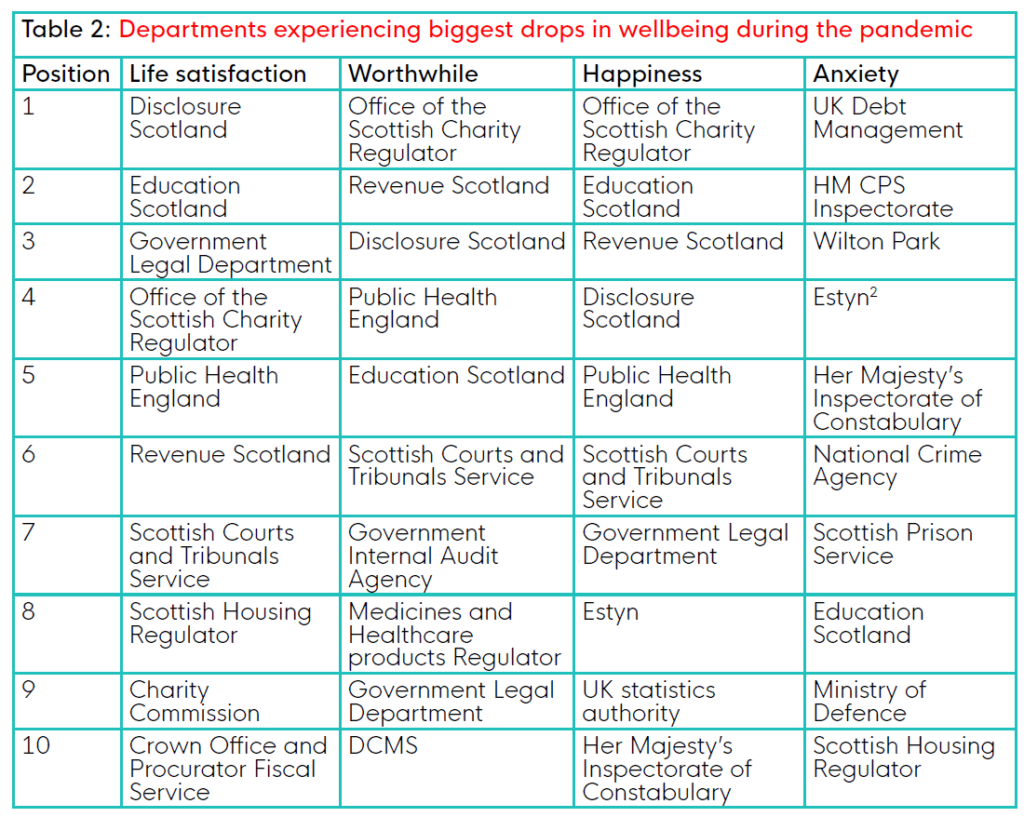
There is a marked drop in wellbeing in Public Health England during a public health crisis, although Public Health England does not appear in the worst increases in anxiety. The same logic might be applied to the Medicine and Healthcare Product Regulator.
Others, however, are less obviously pandemic-related. The two biggest trends that we can identify here are firstly that the regulators and inspectorates appear to have been particularly badly affected. Second, Scottish departments appear to have had an especially difficult 2020, making up between three and seven of the top ten drops in wellbeing. It should be noted that Scottish departments had slightly higher rates of wellbeing on most measures prior to the pandemic.
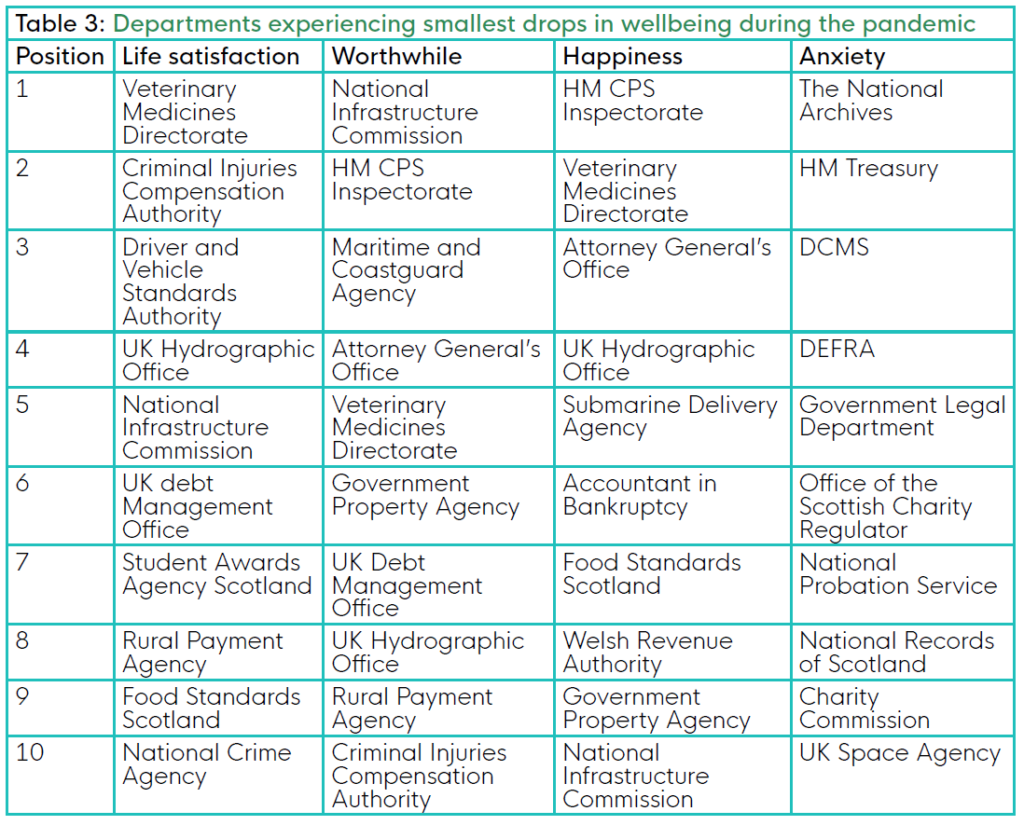
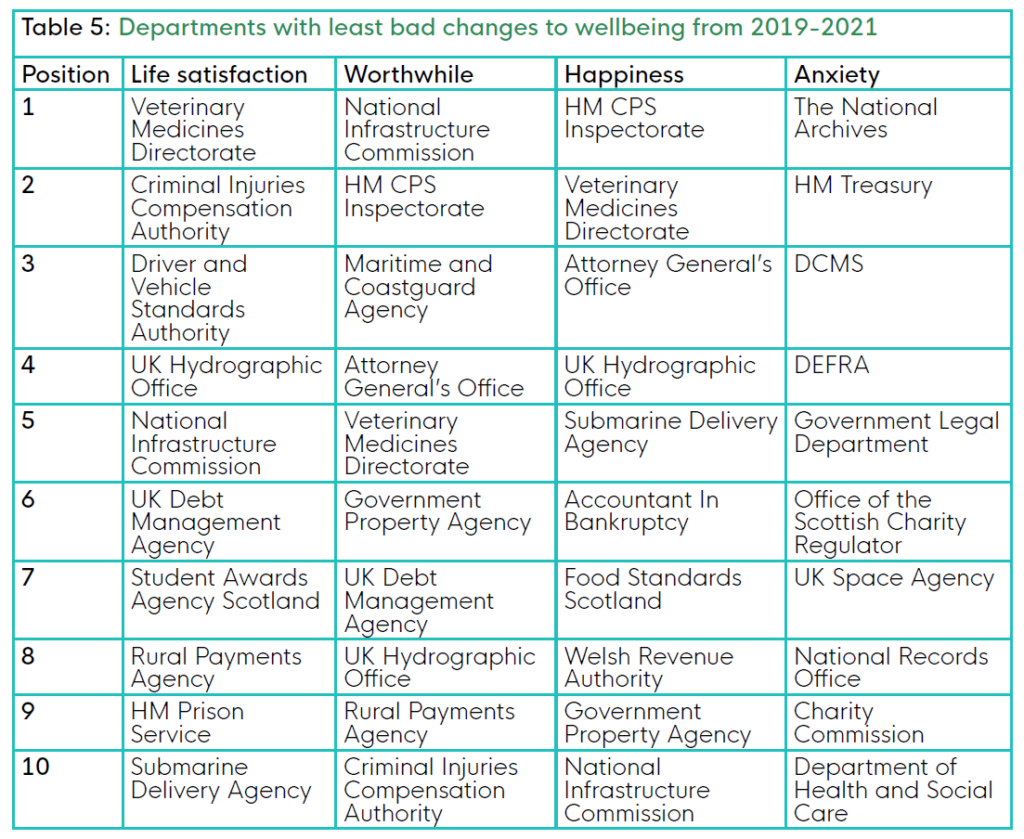
As we described above, the department with the most positive experience of the pandemic is the Veterinary Medicines Directorate. Beyond this, there is little obvious commonality among the departments experiencing smaller negative effects of the pandemic on wellbeing, as measured by year-on-year change in the proportion of people scoring highly on life satisfaction, worthwhile, happiness and anxiety.
Whitehall departments, which are otherwise largely absent from this table and the one before, make up three of the ten best pandemic responses on the measure of Anxiety. Although not as consistent as in the biggest drops table, we should note that three Scottish agencies appear in this table, with one (Food Standards Scotland) appearing in two columns.
Looking at the 2021 data, we can assess which departments or agencies are recovering quicker from the pandemic. Recovery to date is measured by the increase in the proportion of people with high wellbeing on the first three indicators (life satisfaction, worthwhile, happiness) and the largest decrease in proportion of people with high anxiety.
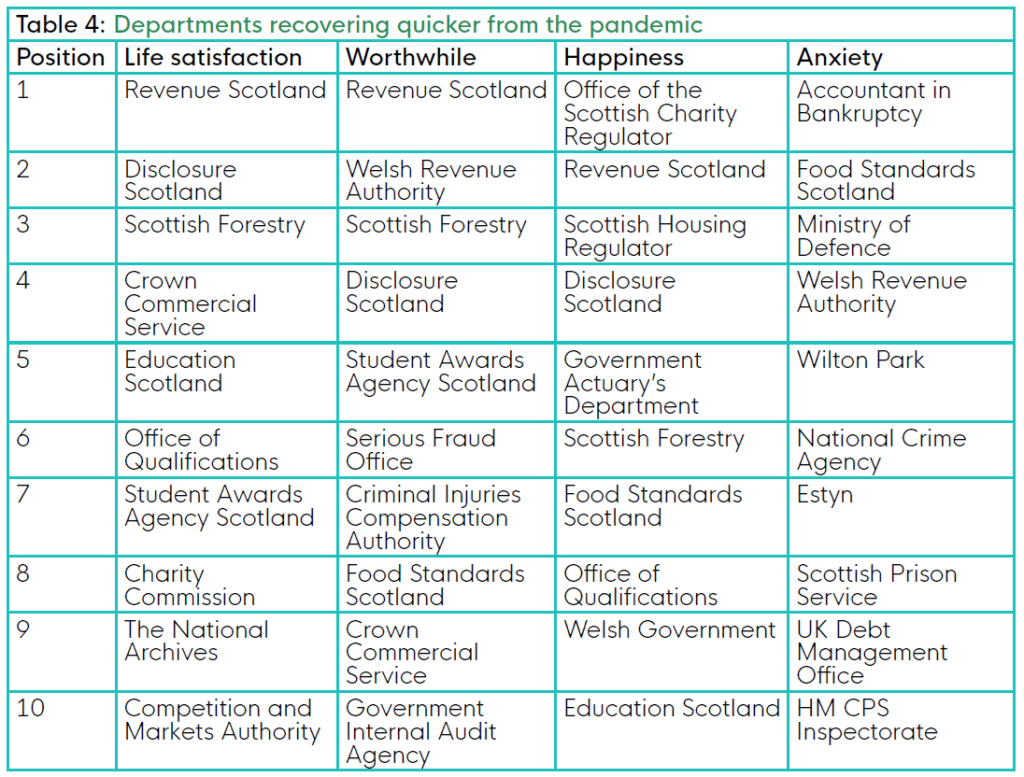
Many departments in Table 4 also appeared in Table 2, suggesting that departments who experienced the worst pandemic are also experiencing the fastest bounce-back. This indicates that the wellbeing effects of the pandemic on civil servants is likely temporary.
This pattern does not allow us to look at who has had the best pandemic overall. After all, a modest dip and a modest recovery are probably better than a big fall and a rapid recovery. To rectify this, we look instead at the second-difference of wellbeing, measuring changes from between 2019 and 2021 data – these findings can be found in Table 5 on the next page.
Central departments
Central government departments, which employ huge numbers of officials, do not make major appearances in our analysis so far; perhaps because they sit in the middle of the distribution of wellbeing overall.
To zoom in on these large and influential departments in particular, we show below three tables. The first of these (Table 6) shows levels of wellbeing in 2021. Table 7 shows changes from 2019-2020 and table 8 shows changes from 2020-2021.
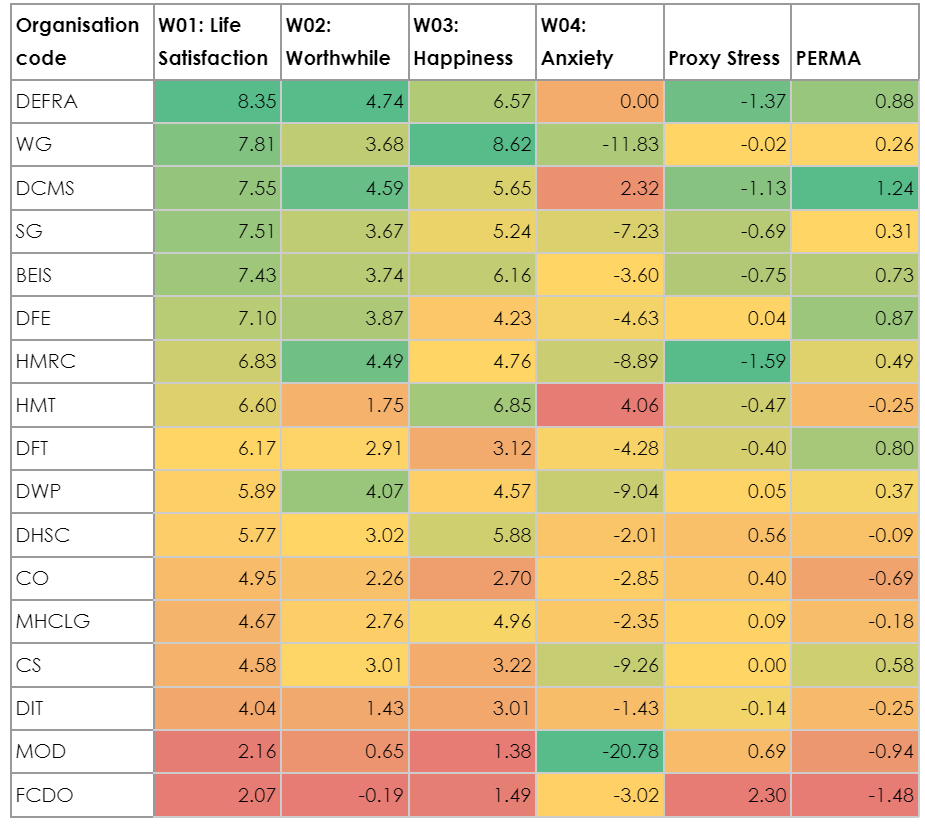
Proxy stress is a combined measure of stress (good/bad) in the organisation based on the HSE management standards. PERMA is a combined measure of the protective aspects of wellbeing based on the PERMA model of flourishing.
The latest data: 2021
Table 6. Levels of civil service wellbeing in 2021.

Table 7. Changes in levels of civil service wellbeing between 2019 and 2020.
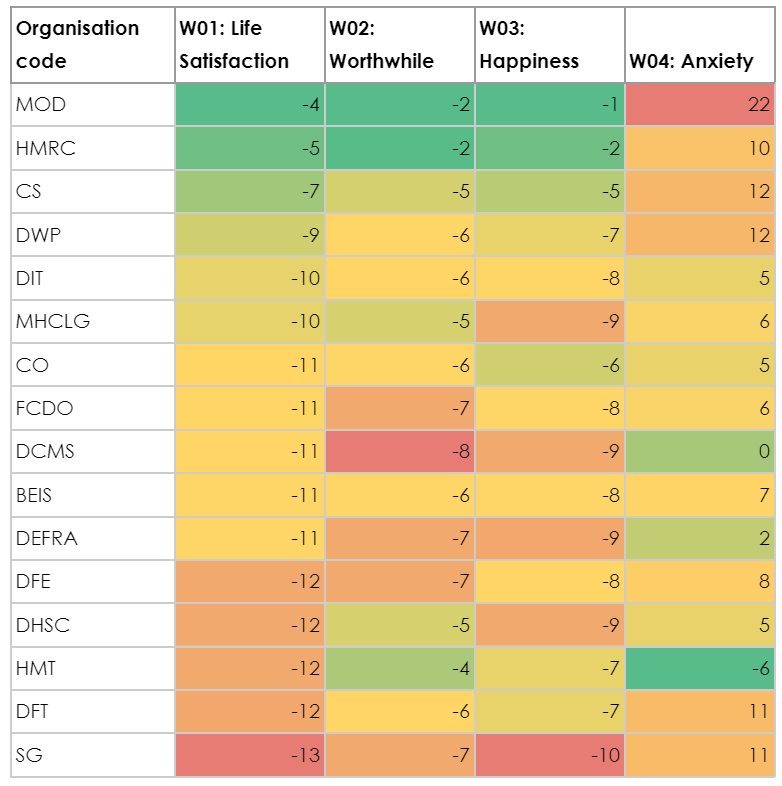
Table 8. Changes in levels of civil service wellbeing between 2020 and 2021.
Conclusions
Over the course of this paper we have considered the wellbeing of civil service departments and related organisations. This dataset, even aggregated to the level of the organisation and year, provides a rich picture of the wellbeing of one of Britain’s largest employers, and one which is responsible for the design and execution of much of public policy.
While civil service wellbeing has generally been tracking upwards in the time that it has been measured, the Coronavirus pandemic has had an enormous and potentially lasting impact on the wellbeing of public servants in the UK.
This pattern is of course not a surprise. The pandemic, with its associated lockdowns and restrictions on everyday life – as well as the illness and mortality that accompanied it – was a bad time for wellbeing across society and up and down the country.
What is perhaps the most interesting is that these findings are not uniform across the public service. Some departments have fared well, experiencing much smaller losses than others, and have recovered more quickly. Some departments’ wellbeing has been much worse hit, and recovered more slowly. These differences do not seem to be explained reliably either by the prior levels of wellbeing in those departments, nor by the nature of the department’s work.
Although this work can only point to quantitative findings and trends, it suggests that future research could look more qualitatively at what departments did in the face of a major negative shock to wellbeing to aid bounce-back. Understanding how they averted the large scale drops in staff wellbeing that were experienced by others could generate testable interventions and approaches for the future.
Suggested citation
Sanders, M., 2022. Civil Service wellbeing over time [online] What Works Centre for Wellbeing. Available at: https://whatworkswellbeing.org/resources/civil-service-wellbeing-over-time/ [Accessed 14 July 2022].
![]()
[gravityform id=1 title=true description=true ajax=true tabindex=49]