Local Authority wellbeing over time
Downloads

Introduction
The wellbeing of the population is an important concern for governments at local and national level. The UK has been among the small number of countries to systematically measure subjective wellbeing, adding a new lens to the health of the nation that provide a distinct measure from economic wellbeing measured through GDP.
This data has been collected for some time and estimated at the level of the local authority across the UK, and these aggregated data are publicly available through national statistics. In this short paper, we consider;
- How wellbeing has changed over the last 10 years at local authority level
- Whether this experience has been uniform across the country, how it has changed over time, and how it responded to the COVID-19 pandemic.
- Whether we can make the first step towards quasi-experimental evaluations of wellbeing by matching local authorities across different time periods in terms of their prior trends of wellbeing.
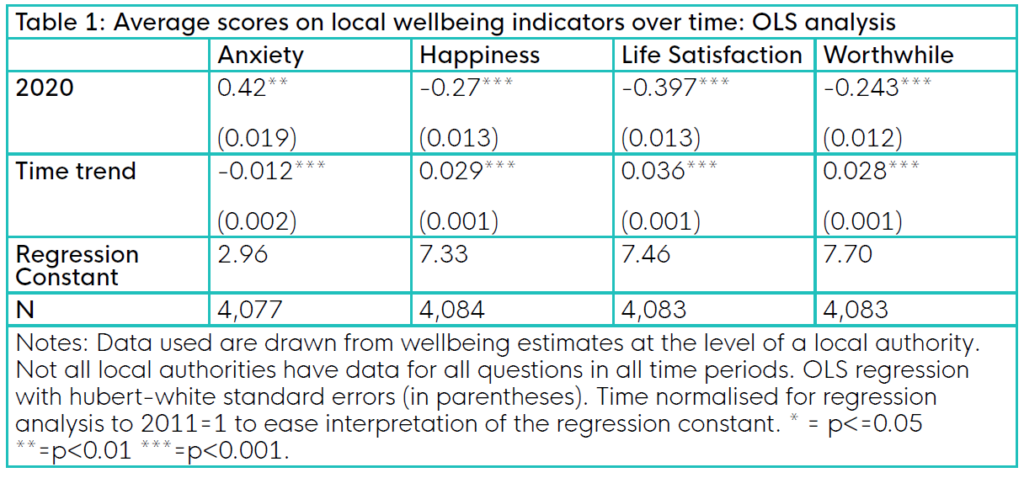
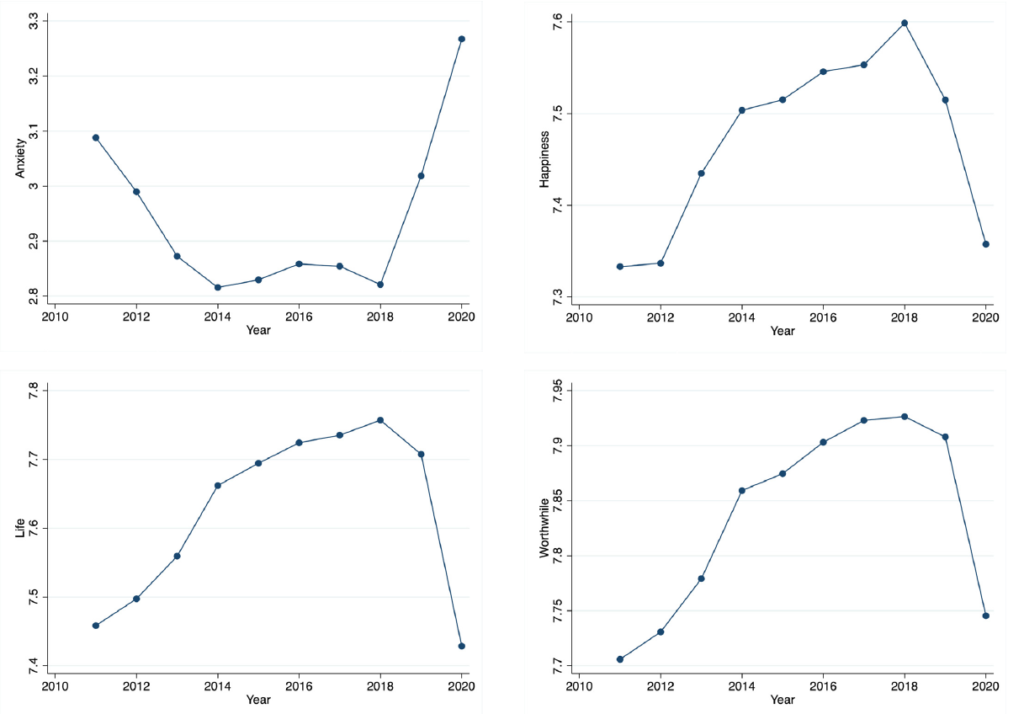
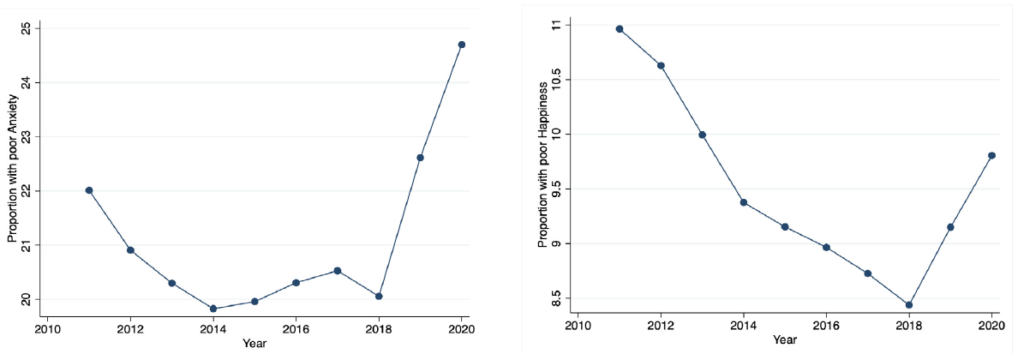
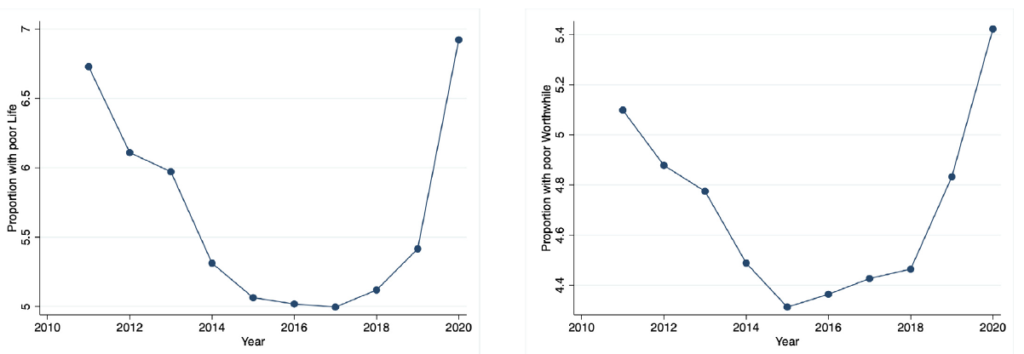
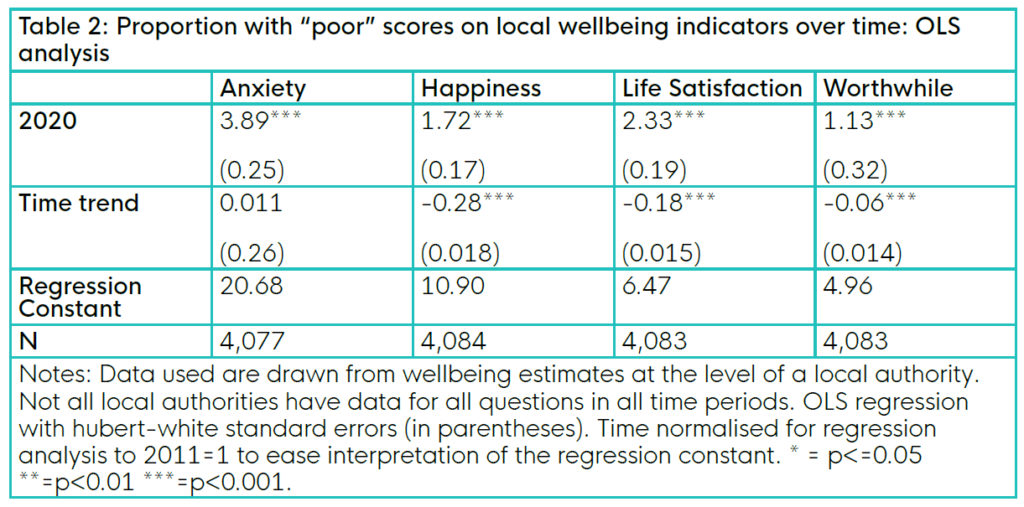
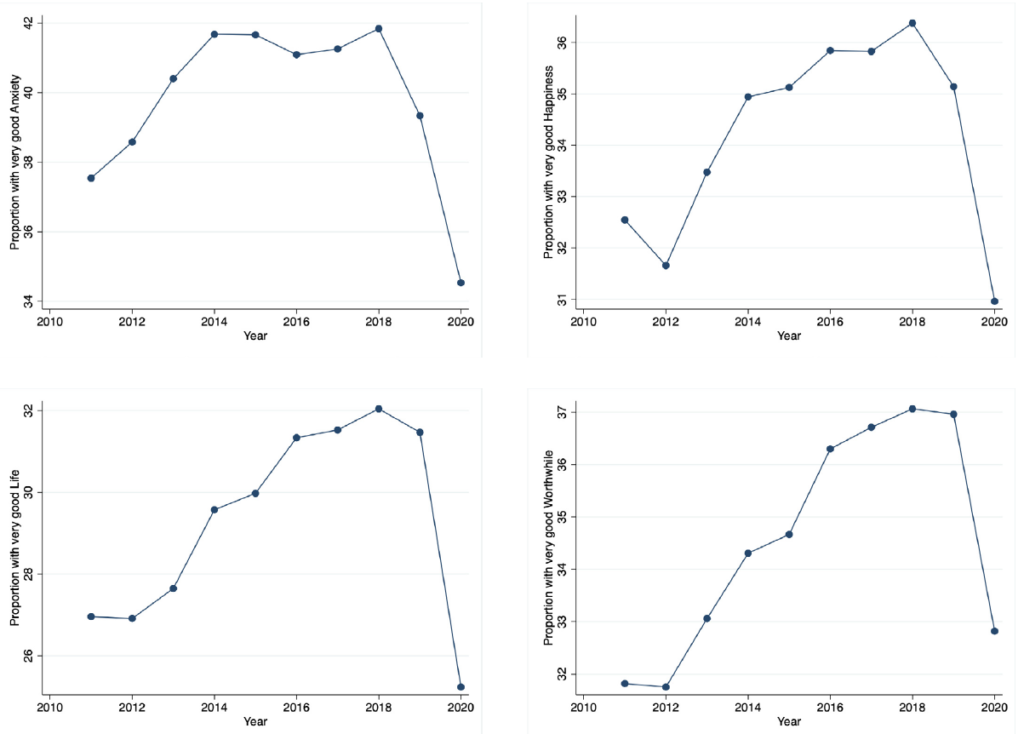
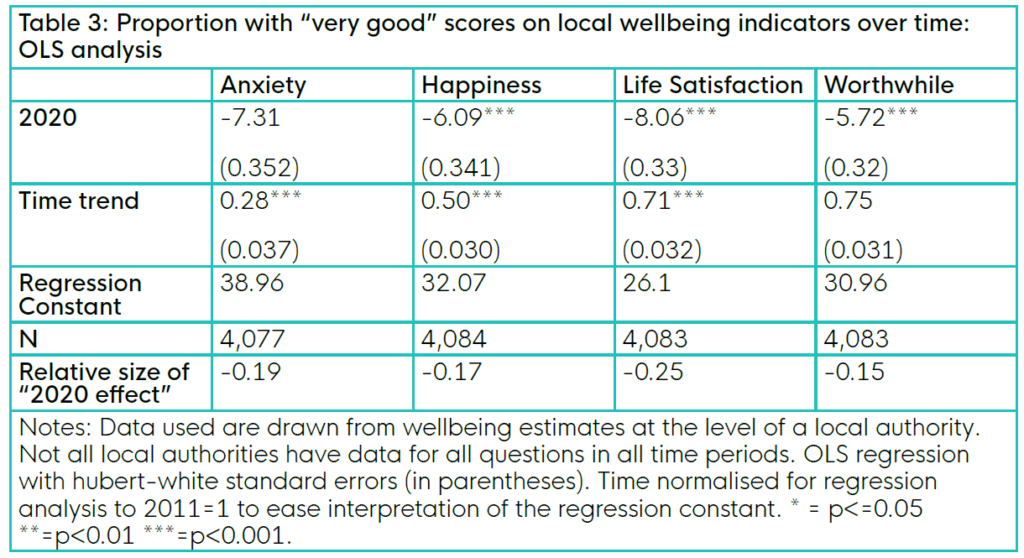
How has wellbeing changed over the last ten years?
We make use of published annual wellbeing data at the level of local authorities, having removed regional and national indicators. For each local authority, we have estimated mean wellbeing for each year, broken down by each of the four ONS Wellbeing Questions. This analysis is looking to tell a general story about local authorities, and so is not weighted by population size – as such, the picture may differ from a weighted national picture, as small local authorities are weighted equally with larger ones.
For each question, we reshape the data and restructure it as a panel dataset at the level of the individual local authority. From this, we are able to create a time series for each of the four wellbeing questions over the years covered by the data (which start with the 2011-2012 year and finish in 2020-2021. These findings can be seen in the four graphs overleaf, which show a rise in anxiety and a steep fall in happiness, life satisfaction, and the sense that life is worthwhile.
This is further supported by regression analysis, in which we regress each of the wellbeing questions on a time trend and a binary indicator for being in 2020-2021, the results of which can be seen in the table below, and which shows a significant worsening of all wellbeing measures in 2020.
So far, we’ve looked at changes in average levels within local authorities over time. Instead, we might be legitimately interested in how authorities have changed distributionally. One easy way to look at this is to look at changes in the proportion of people categorised as having ‘poor’ or ‘very good wellbeing on each of the four indicators. Looking at these indicators helps us understand as well the impacts of the pandemic. If the falls we observe are mainly a consequence of people with “very good” wellbeing moving into merely “good”, we might be less worried than if people with “fair” wellbeing are falling to having “poor” wellbeing.
The four figures below show changes over time in the proportion of people on average reporting as “poor” for each of the four metrics in turn. This is followed by a regression table evaluating this proportion.
As we can see, there is a marked increase in the proportion of people with poor wellbeing in 2020. Prior to 2020, the general trend over time is towards fewer people having poor scores for on all of the metrics except for Anxiety, which was rising over time, albeit not statistically significantly. The changes in poor wellbeing are pronounced in 2020 even compared to average changes, relative to trend. Taking the three positive wellbeing questions, it would take an average of 12.6 years at pre-pandemic trends to recover the damage done in terms of the proportion of people with poor wellbeing scores, compared to 9.5 years to recover the damage to the mean.
Next, we can look at the rates of ‘very good’ wellbeing, through the next four graphs and the subsequent regression table.
There is, perhaps unsurprisingly, a large and off-trend decline in the proportion of people experiencing very good wellbeing scores. Unlike the proportion of people with poor anxiety scores, which showed no significant movement over the bulk of our data period, all four indicators show a positive and significant trend on the proportion getting ‘very good’ scores. Although the absolute levels prior to the onset of the pandemic were higher than those of ‘poor’ wellbeing scores, the declines are also larger in magnitude. To attempt to arrive at a common currency for the effects, we calculate a proportionate ‘2020’ effect for both indicators, showing the relative change in the proportions in each group in 2020. Here, we see a relatively smaller proportionate change in the proportion of people with ‘very good scores’ relative to people with ‘poor’ scores.
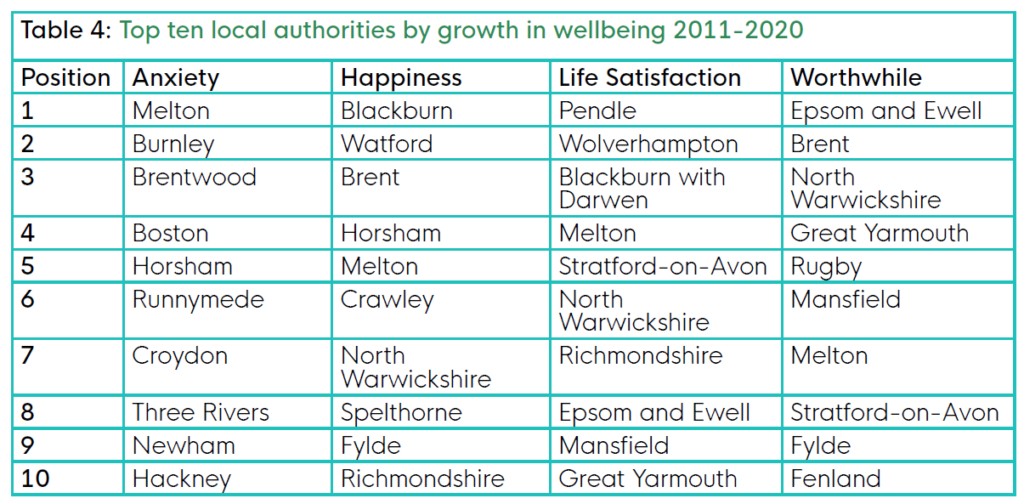
Which authorities have improved most during the last ten years?
As well as caring about the overall levels and trends, we are interested in outliers – those local authorities that have performed particularly well since the data began to be collected. For this analysis, we omit the final year of the data (the pandemic year), on the basis that this is an unusual event with profound negative consequences for wellbeing across the country.
The table below shows the ten local authorities exhibiting the largest growth in each of the four wellbeing questions over the period 2011-2012 to 2019-2020 (the first and penultimate years in our data).
Has the change during the pandemic been uniform?
We now consider whether changes in the four wellbeing questions have been uniform across the country. We would of course not expect every local authority to experience the same magnitude of fall, and this can be seen in the density plots below, which show the distribution of changes between the 2019-2020 data and the 2020-2021 data for each local authority.
These curves are broadly normally distributed, and mean centres around a positive value for anxiety and a negative value for the other values. In each case, there are a number of local authorities which show the opposite to the nationwide trend.
In fact, 22% of local authorities experience a drop in anxiety, 7.5% experience a rise in life satisfaction, 15% a rise in life being worthwhile, and 22% a rise in happiness, despite the strong adverse national trend.
In fact, 11 local authorities experience positive changes in all four wellbeing questions moving from 2019-2020 into 2020-2021. These are;
- Breckland
- Broadland
- Chorley
- Derbyshire Dales
- Lewes
- Lincoln
- Preston
- South Ribble
- Torridge
- Uttlesford
- Wyre
There is no obvious relationship between increase in a variable in 2020-2021 and either raw scores in 2019-2020 (p=0.778), or the trend between 2018-2019 and 2019-2020 (p=0.648), suggesting that these findings are not driven by simple mean reversion.
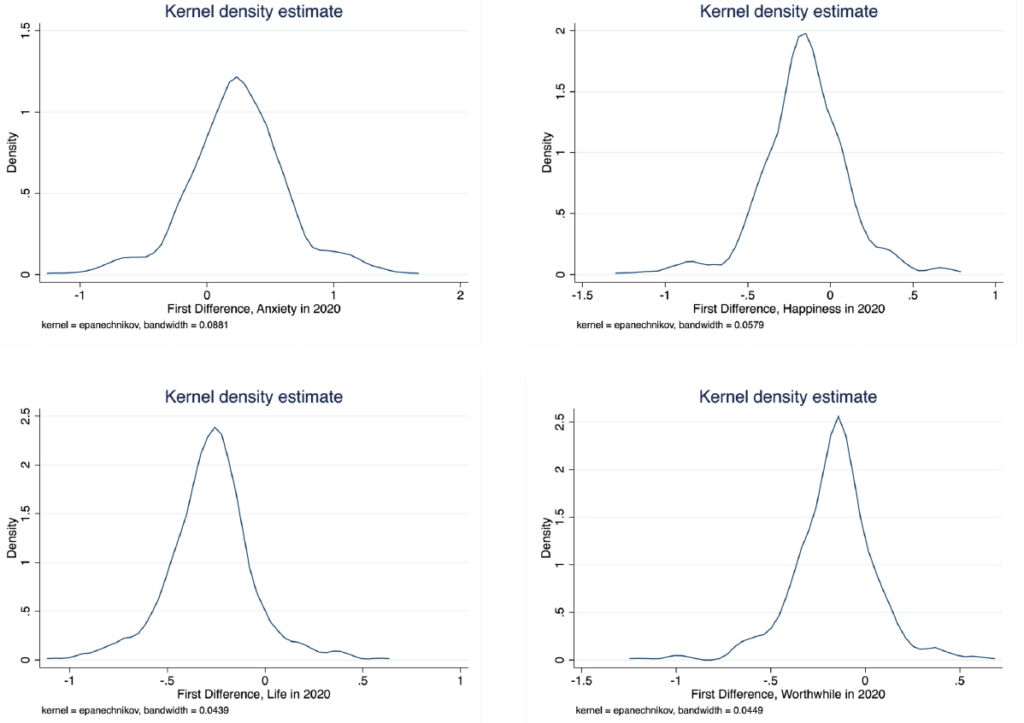
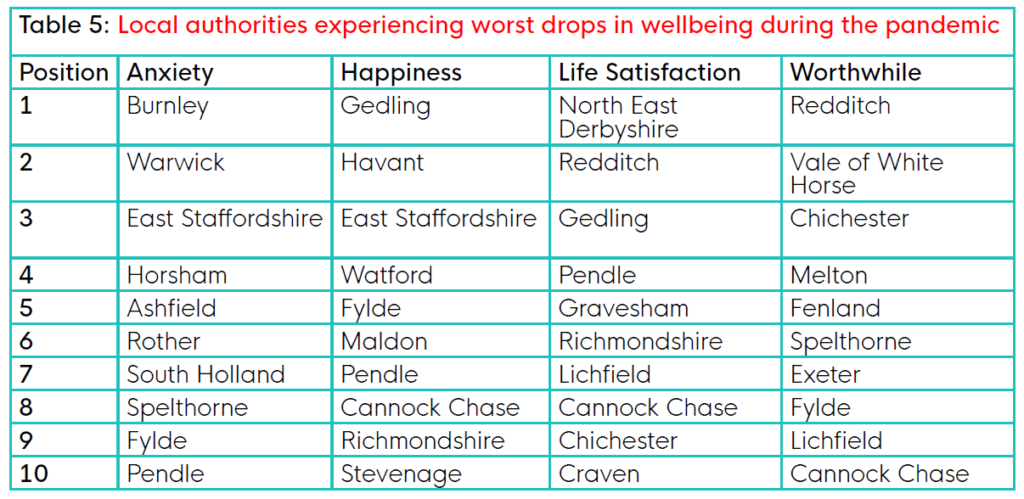
Which authorities suffered the most in terms of wellbeing during the pandemic?
We now look at which local authorities showed the largest drop in wellbeing between their 2019-2020 and 2020-2021 data, presenting the top ten drops for each of the four wellbeing questions. These are the local authorities which experienced the worst drop in wellbeing during the pandemic year. Although this is not strictly speaking a causal relationship, the size of the drop during the pandemic year is so substantial, and the scale of the pandemic so large, that it is difficult to attribute these changes to another cause.
There is, perhaps unsurprisingly, a large and off-trend decline in the proportion of people experiencing very good wellbeing scores. Unlike the proportion of people with poor anxiety scores, which showed no significant movement over the bulk of our data period, all four indicators show a positive and significant trend on the proportion getting ‘very good’ scores. Although the absolute levels prior to the onset of the pandemic were higher than those of ‘poor’ wellbeing scores, the declines are also larger in magnitude. To attempt to arrive at a common currency for the effects, we calculate a proportionate ‘2020’ effect both indicators, showing the relative change in the proportions in each group in 2020. Here, we see a relatively smaller proportionate change in the proportion of people with ‘very good scores’ relative to people with ‘poor’ scores.
Suggested citation
Sanders, M., 2022. Local Authority wellbeing over time [online] What Works Centre for Wellbeing. Available at: https://whatworkswellbeing.org/resources/local-authority-wellbeing-over-time/ [Accessed 14 July 2022].
Downloads
You may also wish to read the blog article on this document.
Downloads
You may also wish to read the blog article on this document.
[gravityform id=1 title=true description=true ajax=true tabindex=49]