November 2017
Understanding Local Needs for Wellbeing Data
Downloads
In partnership with
Intro
This report has been updated in November 2017 to include an attribution to the Warwick-Edinburgh mental wellbeing scale.
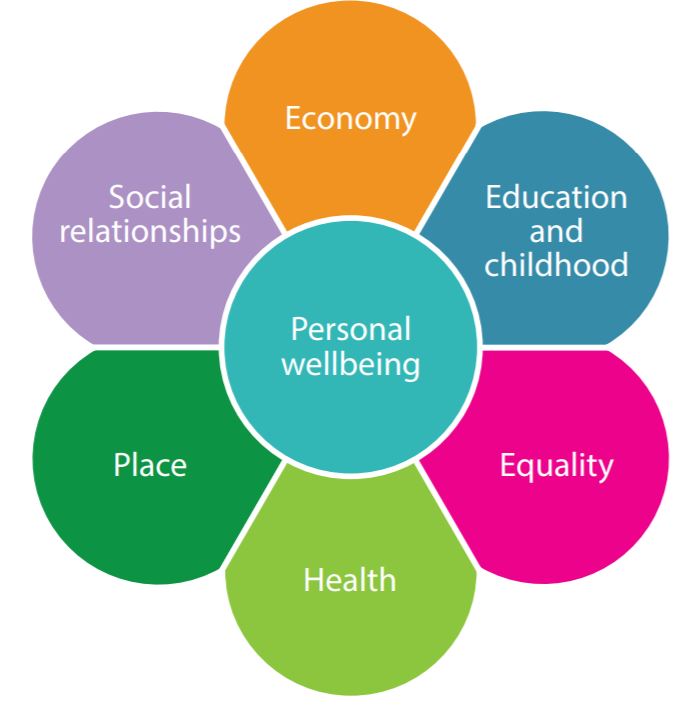
Local Wellbeing Indicators use existing data and the best research to show true picture of local residents’ lives and community wellbeing. Indicators look at personal relationships, economics, education, childhood, equality, health, place and social relationships- currently no local authority uses all of this data in one place to meet local needs.
Executive summary
Methodology
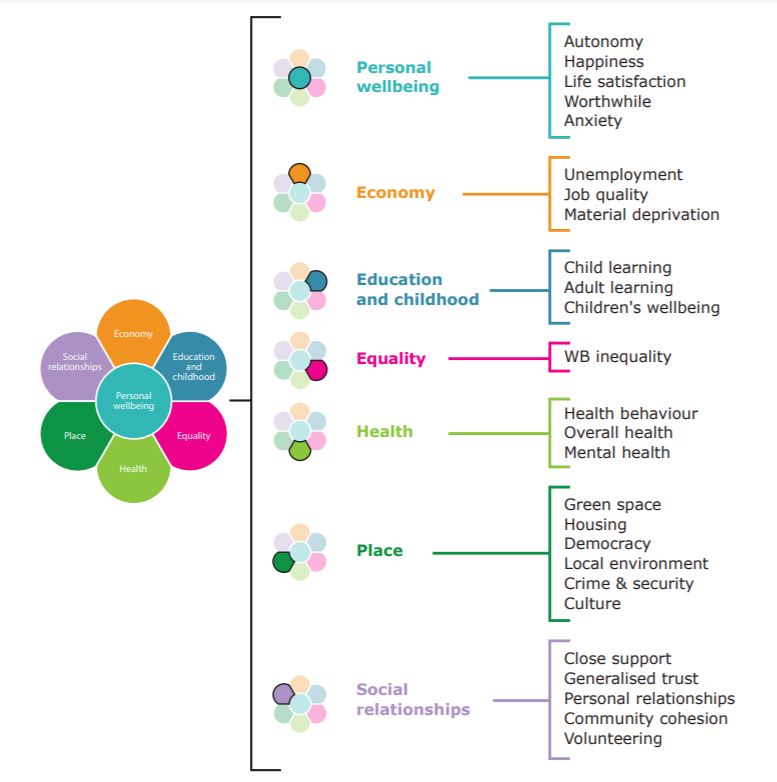
Final framework
Downloads
![]()
[gravityform id=1 title=true description=true ajax=true tabindex=49]