Children’s wellbeing in the UK 2022
Today’s publication of the Good Childhood Report 2022 by The Children’s Society marks the eleventh in a series of annual reports about how children in the UK feel about their lives.
We reflect on the report’s key findings and explore why consistently capturing a holistic picture of how young people feel about their lives at a national level is important.
Key findings and trends
- Family, health and home – on average, children aged 10-17 who took part in the annual Children’s Society Household Survey (CSHS) in 2022 were most happy with their family, their health, and their home.
- A continued decline in children’s wellbeing – on average, children completing the Understanding Society survey (aged 10 to 15) were more unhappy in 2019-2020 than 2009-2010, with mean happiness scores for life as a whole, friends, appearance and school significantly lower. One in 16 UK 10-15 year olds were unhappy with their lives.
- Impact of school – 14.2% of children aged 10-17 scored below the midline for happiness with school in the CSHS 2022.
- Impact of appearance – in 10 of 11 Understanding Society surveys conducted between 2009-10 to 2019-20, children were more unhappy about appearance than the five other aspects of life they were asked about. 18% of 10-15 year old girls were significantly unhappy with their appearance in 2019-20, which is 8 percentage points higher than boys, and 3 percentage points more than a decade ago.
Children’s experience of school
This year the report explores children’s happiness with and experiences of school in more detail.
Children surveyed in 2022 via the CSHS were asked what school year they were in, enabling researchers to explore differences in wellbeing between these educational and transitional phases. On average, those in key stages 2 (primary) and 5 (further education) were happier than key stages 3 and 4 (secondary school).
Children who said their family was not well off were also less happy with school on average, suggesting a link between children’s happiness with school and their perceptions of their family’s wealth. This is echoed by the Understanding Society data from 2019-20, which shows happiness with school work declined significantly from 8.1/10 at age 10 to 6.6/10 at age 15, and was significantly lower among children in lower income households.
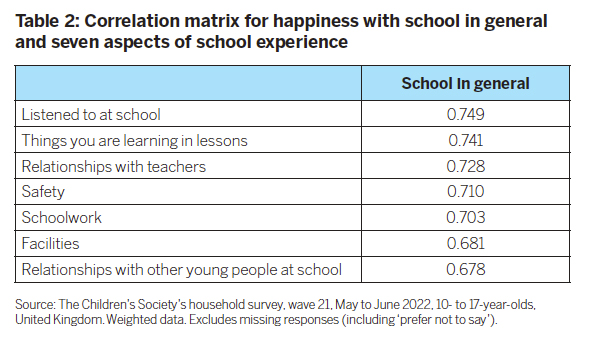
Using data from the CSHS, the report identified seven factors that had strong positive correlations with children’s overall happiness with school, based on:
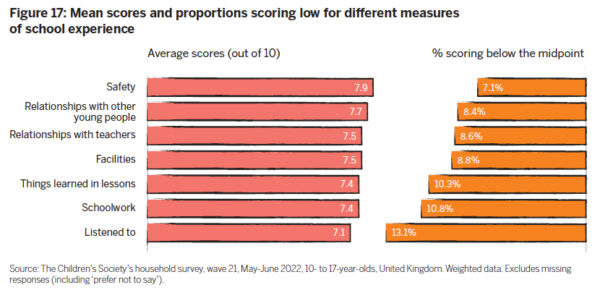
These explain two thirds of young people’s happiness with school experience, after controlling for age and gender:
Disparities between sexes persist
Across the Understanding Society surveys conducted between 2009-10 and 2019-20, boys were also consistently happier than girls with appearance, but less happy with schoolwork in eight out of eleven surveys:
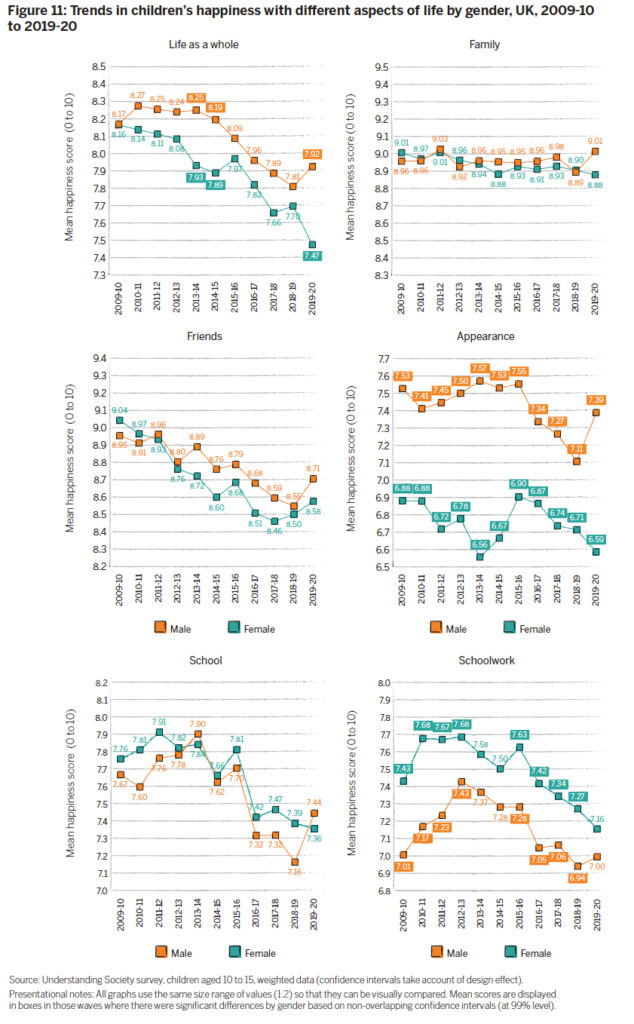
Previous research has indicated that being male is associated with lower mental health difficulties and higher subjective wellbeing in adolescence. We also know that wellbeing declines as children get older, with this being steeper and starting earlier for girls. This needs further understanding. A question remains as to whether male distress is being picked up sufficiently in survey questions.
What are the implications and what’s next?
1. National measurement of children’s wellbeing
We know that a strong predictor of adult life satisfaction is their emotional health in childhood. Low wellbeing (0-4 out of 10) can be predictive of later poor wellbeing and mental health problems up to 8 years later. Combined with loneliness, low wellbeing can decrease chances of moving from education to employment.
To fulfil the Levelling Up mission of improving wellbeing for the UK population, we need to regularly capture how young people are doing at a national scale. This can be achieved through consistent and robust measurement of wellbeing and its drivers, as is already happening for adults. Data should be captured annually as part of the National Pupil Database in England and the Pupil Level Annual School Census in Wales so we can see the link between performance and wellbeing.
Not all children’s experiences are fully captured by surveys and smaller sample sizes. This is why nationally captured data should be analysed at a local level, and we should look beyond the averages.
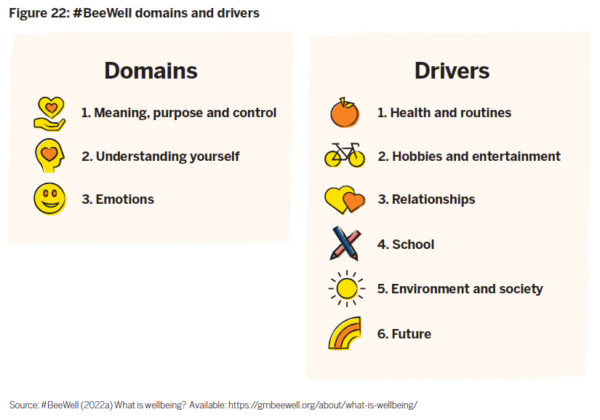
The learnings should also be made publicly available for organisations and communities to work together at a neighbourhood level, as it is being done in Greater Manchester through the #BeeWell project which engaged almost 40,000 children. A key starting point was to find out what wellbeing means to young people. In collaboration with young people and the questionnaire advisory group, they arrived at three key domains of wellbeing and identified six key drivers of wellbeing [Figure 22].
The project has enabled young people to be involved in local decisions, feeding back their thoughts on wellbeing to elected representatives. #BeeWell measures are being adopted by the Greater Manchester Combined Authority (GMCA), ensuring young people’s wellbeing will be at the heart of future strategy.
2. Understanding what impacts children’s happiness with how they look
Happiness with appearance has decreased over time from 2009-2010 to 2019-2020, and across all waves, more girls were unhappy with their appearance than with any other measure.
Our previous body image research looked at adult female Instagram users and suggests a positive correlation between how women feel about their bodies and how satisfied they feel with their lives as a whole. Exploratory recommendations from our research include formulating clear guidance on how images and messages about body image can be communicated positively online. We need to further explore the drivers of satisfaction with appearance for children.
3. Putting wellbeing at the core of education
After parents, the next major influence on children are their schools, both primary and secondary. It is clear from the report that education is a source of unhappiness for a proportion of children. To address this, attention needs to be placed on prevention and early intervention. Read our previous blog in response to the Times Education Commission Final Report to explore our suggestions on what we know already works.
Data sources
The Children’s Society Household Survey – collects regular data on different measures of children’s wellbeing including the Good Childhood Index. The most recent survey was undertaken between May and June 2022, and collected responses from a sample of over 2,000 children from across the UK, aged 10 to 17, and their parent or carer.
Understanding Society – a longitudinal survey covering a large representative sample of around 40,000 households in the UK. The youth questionnaire contains routine questions on subjective wellbeing and modules which vary between years on other aspects of children’s lives. The most recent survey data available are for 2019-20, completed by 2,100 children (aged 10 to 15).
Blog
![]()
[gravityform id=1 title=true description=true ajax=true tabindex=49]