New ONS data: Life in the UK 2016 measures of national wellbeing update
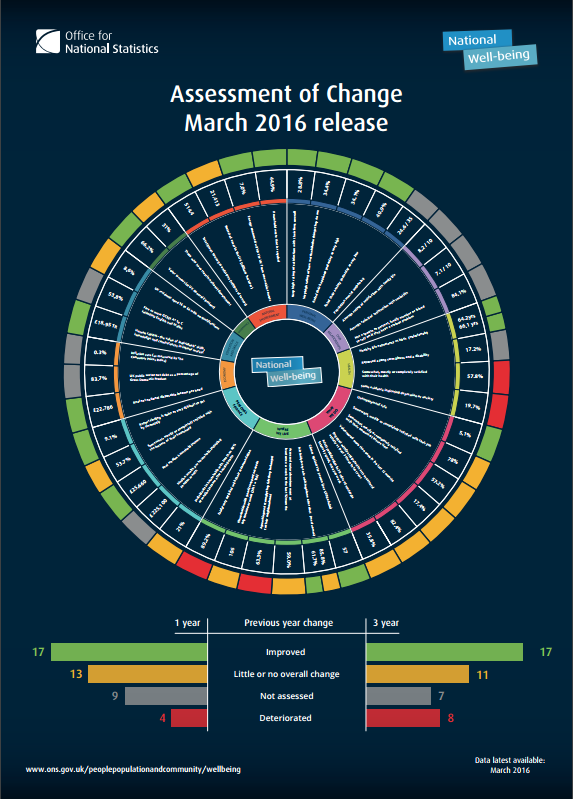
The Office of National Statistics has released Life in the UK 2016, a snapshot of life today across the 10 domains and 41 measures of national wellbeing.
 Organised into 10 domains, such as Health, Where we live, Education and skills and Natural environment, the report highlights ‘how we are doing’ as individuals and as a nation and how sustainable this is for the future. The measures include both objective data (for example, healthy life expectancy) and subjective data (for example, satisfaction with health) in order to provide a more complete view of the nation than measures such as Gross Domestic Product (GDP) can do alone.
→Assessment of Change on Wellbeing wheel
Of the 41 measures, assessments of change show that 17 have improved while 8 have deteriorated and 11 have stayed the same over the 3 year period.
How are we doing as a nation?
Things which have got better:
- personal finances: real median household income and net national disposable income have both risen and the unemployment rate has fallen
- healthy life expectancy continues to rise for both men and women,
- the number of crimes against the person has fallen
- more of us turned out to vote at the last general election than the previous one.
- environmental measures. Greenhouse gas emissions have fallen, the extent of areas designated as ‘protected’ has grown and a growing proportion of us accessed the natural environment during the 3 year period examined. More energy has been consumed from renewable sources in the last year than in previous years and recycling rates have risen
And worse:
- The proportions satisfied with their health, accommodation, household income and leisure time have all fallen over the three year period
- Population mental wellbeing scores fell over the three year period as did the proportion who had a spouse or partner, family member or friend to rely on if they had a serious problem.
- Adult participation in sport has also fallen.
How are we doing as individuals?
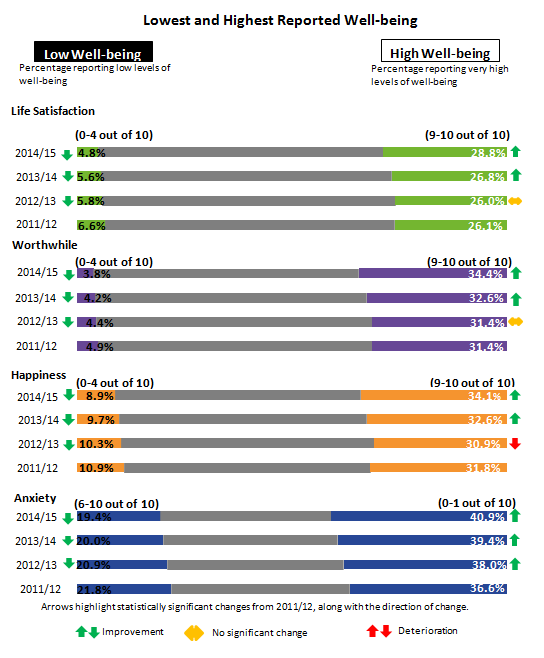
Life in the UK shows an improvement  across all 4 measures of personal wellbeing, this suggests that more people in the UK are feeling positive about their lives than in the financial year ending 2014.
Between 2011/12 and 2014/5 the rates of those reporting low wellbeing has dropped whilst the numbers reporting high wellbeing have increased.
→Personal wellbeing in the UK 2014/15 statistical bulletin
→How to add subjective WB to evaluations
Updated datasets:
→National wellbeing measures dataset
→Similar approach taken in Scotland since 2008 with their National Performance Framework
