What wellbeing inequalities tell us about the EU Referendum result
Inequalities of wellbeing in the UK can help us understand the EU referendum result
- High wellbeing inequality was a strong predictor of an area voting to leave.
- Wellbeing inequality is driven by unemployment rates and ‘governance’.
- Governance is how people view the quality of society, its functioning and its institutions. This includes voice, accountability, satisfaction with government & the economy, trust in institutions or the control of corruption.
- Areas with high average wellbeing had higher turnout.
Lord Gus O’Donnell, Patron of the What Works Centre for Wellbeing
“This research demonstrates the importance of inequalities in explaining why people voted to leave. It provides strong supporting evidence for the views expressed by the Archbishop of Canterbury in the Lords this week. It is also an excellent example of how viewing the world through the wellbeing lens provides vital insights into what is really worrying people.
Personal wellbeing is measured by how satisfied people say they are with their life in the ONS statistics.
 Analysis & Comment by Saamah Abdallah from the Centre’s Community Wellbeing team:
The causes of the referendum result are deep-rooted and complex. Economic inequality has been touted by many as the main cause, whilst others have focused on the alienation of the white working classes.
One factor which has not been discussed much is wellbeing. Might low wellbeing explain the decisions of many to turn over the apple cart and vote to leave the EU? Previous research at the LSE has shown, for example, that low average wellbeing predicts the likelihood that an incumbent government will be voted out in an election.
At the New Economics Foundation we looked at data from the Annual Population Survey, which asks over 160,000 people a year a set of four wellbeing questions, including a question asking how satisfied they are with their life, using a scale of 0 to 10. Looking at the voting pattern across the country, it turns out that places with lower average wellbeing did not have a different pattern of voting, but they did have lower turnout.
As part of our work for the What Works Centre, we are also exploring how to measure wellbeing inequality – how much variation in levels of wellbeing there is in a particular place. Just as looking at average income can hide important disparities in the distribution, so too can looking at average wellbeing. We’ve used an indicator called ‘mean pair distance’ – if you take two random people in an area, what’s the average difference between them in terms of how satisfied they are with their life? Doing so, we found that high wellbeing inequality was a strong predictor of an area voting to leave.
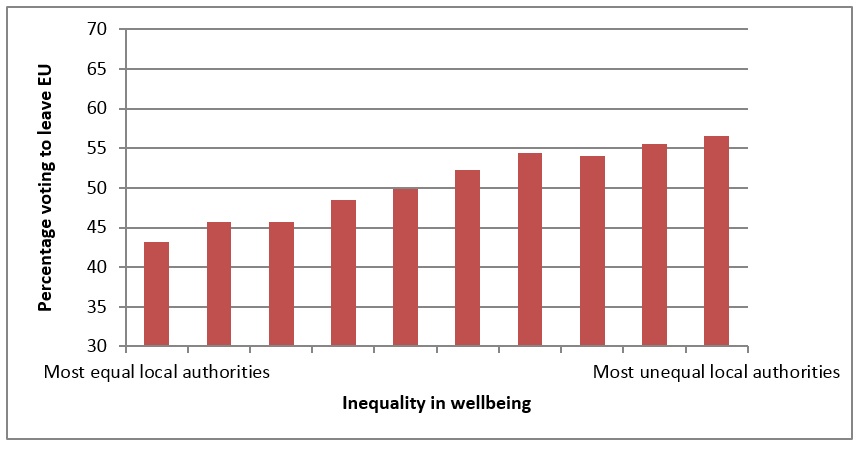
Differences in wellbeing inequality range from 2.4 in Blaenau Gwent in the Welsh valleys, to 1.5 in Cheshire East and Falkirk. Overall, we found that those areas such as Blaenau Gwent that had high levels of inequality overwhelming voted to leave, whereas those with low levels of inequality voted to remain. On average, in the 20 most unequal places in Britain, 57% of voters opted to leave. In the 20 most equal places, only 43% voted to leave.
We found that wellbeing inequality was associated with voting behaviour even when taking into account the percentage of residents with higher education (which has already been highlighted in the Guardian as the most important predictor of voting behaviour), and the percentage of the population that categorises itself as ‘White British’, thus controlling for ethnic diversity.
Higher local income inequality (measured using the 80:20 ratio) was not at all associated with voting to leave.
More research will be needed to explore the reasons for this relationship, but this year’s World Happiness Report argues that wellbeing inequality captures the subjective experience of inequality better than objective measures of income inequality. And it seems it is this subjective experience of inequality that has driven many people to feel dissatisfied and frustrated with seemingly distant elites.
How can wellbeing inequality be reduced? We’ll be exploring that question further as part of the What Works Centre for Wellbeing. In previous research, looking at data across Europe, we found that levels of wellbeing inequality were predicted by levels of unemployment and the quality of governance, particularly voice and accountability.
Practice Examples
Blog
![]()
[gravityform id=1 title=true description=true ajax=true tabindex=49]