Wellbeing and age: the triple dip
Downloads
In partnership with
Wellbeing and age: the triple dip
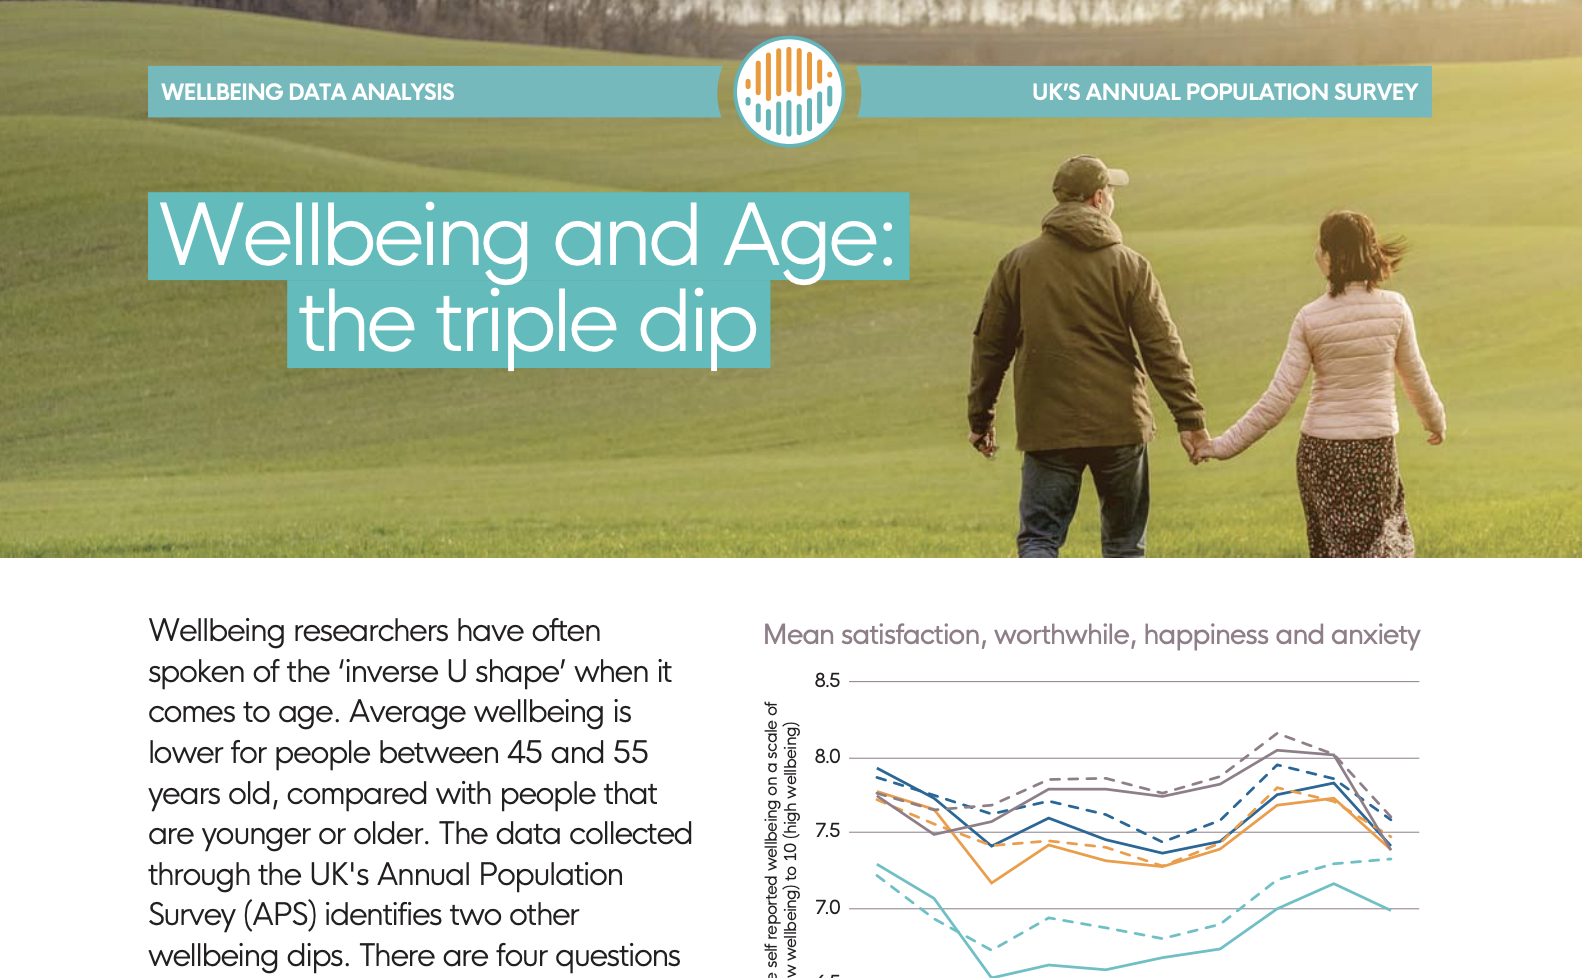
Wellbeing researchers have often spoken of the ‘inverse U shape’ when it comes to age. Average wellbeing is lower for people between 45 and 55 years old, compared with people that are younger or older. The data collected through the UK’s Annual Population Survey (APS) identifies two other wellbeing dips. There are four questions included in the APS that ask people how they are doing, and each question gives different insights into the wellbeing dips for people of different ages.
Anxiety in early adulthood
Wellbeing tends to be high on average for the youngest age group in the data (16-17), but the proportion of people with low worthwhile and high anxiety starts to pick up in the 18-19 age group. By 20-24, average levels of anxiety are higher for this age group than any other. In the most recent data for 2020, average levels of happiness is also at its lowest for this group.
Unsatisfied in midlife
In the 45-55 age group the average level of life satisfaction is at its lowest. All of the ONS 4 measures show a ‘dip for this age group, with anxiety high and sense of purpose and happiness low, this holds after having controlled for other factors affecting wellbeing, such as employment status and health.
Lack of purpose in later years
The proportion of people with low happiness and life satisfaction increases for those in the older age group aged 85+. The sense that the things we do are worthwhile shows the biggest dip, with the lowest levels for any group. This has been exacerbated by the Covid-19 pandemic, with low wellbeing increasing across these three measures in the past year. At the same time however, average levels of anxiety and the proportion of people with high anxiety are relatively low compared to other age groups.
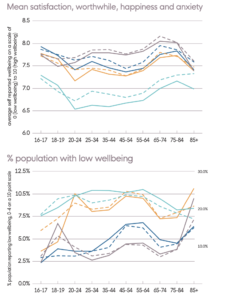
Dashed lines in the chart represent data from the Annual Population Survey March 2019 – March 2020.
Solid lines is data collected April – September 2020, during the Covid-19 pandemic.
The findings described are supported by statistically significant results in regression analysis that controls for other important factors that influence wellbeing.
The four subjective wellbeing questions included in the annual population survey ask people to report on a scale of 0-10
- Overall, how satisfied are you with your life nowadays?
- Overall, to what extent do you feel that the things you do in your life are worthwhile?
- Overall, how happy did you feel yesterday?
- Overall, how anxious did you feel yesterday?
Anxiety scores have been inverted on the charts such that low scores represent high levels of anxiety (low wellbeing).
Downloads
You may also wish to read the blog article on this document.
![]()
[gravityform id=1 title=true description=true ajax=true tabindex=49]