Think back 10 years to 2011. This was a year in which riots broke out across England, there was a royal wedding, the start of the Arab spring and when Game of Thrones first hit our screens. How were you feeling back then? And how does that compare with how you are feeling today? Is life better or worse? Are you happier or more stressed?
Ten years ago the Office for National Statistics (ONS) started asking people in the UK these questions. Building on several years of work, the Prime Minister at the time, David Cameron, supported the launch of the UK’s approach to measuring wellbeing. This included a public dialogue asking what mattered most to people. This was distilled into a wellbeing framework of 10 domains with 42 indicators that would be used to measure and track the wellbeing of the UK. The dimensions and indicators included things already recognised to be high up the agenda for the government, such as inflation and unemployment rates and healthy life expectancy. But it also included more novel things when it came to policy priorities, like the quality of our personal relationships, how much we volunteer, environmental protections and how much we trust the government.
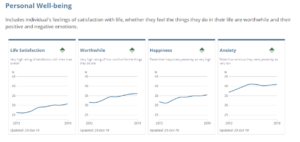
Whilst UK-level data for many of these indicators had been collected for some time in different national and international surveys, there was one particularly novel dimension for which it was necessary to gather new data. The ‘personal wellbeing’ domain asks people directly to give their own accounts of how they are doing and how they are feeling. Individuals are their own judge of their wellbeing, taking into account everything that matters to them, regardless of how they might appear to others. This makes it a powerful, important and democratic measure for how society is doing overall, complementing the more objective and domain based indicators included in the framework.
The set of questions (referred to as the ONS4) specially asks people about:
- Overall satisfaction with life
- Extent to which they feel their life is worthwhile
- How happy they felt yesterday
- How anxious they felt yesterday
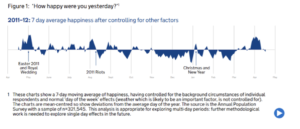
As a result, we do actually know how people in the UK said they were doing 10 years ago. Figure 1 finds we were on average quite happy around the time of the royal wedding, and that our happiness was lower in the wake of the summer riots.
With a decade’s worth of data, we can also see that since then, on average, wellbeing in the UK has got a bit better, with all four measures showing a small but steady improvement.
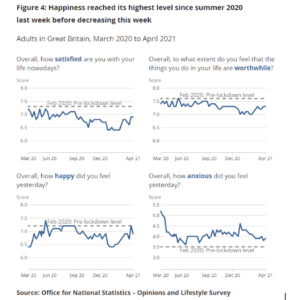
However, the improvement came to an abrupt halt in March 2020 as the Covid-19 pandemic hit all of the drivers of wellbeing, from our health to our relationships. The ONS included the ONS4 questions in their more responsive Opinions and Lifestyle Survey, which has allowed us to track subjective wellbeing in the UK week to week and month to month.
In the first few weeks, it was our anxiety that saw the most significant increase. This started to reduce as we started to understand the virus and got used to the new normal. It increased again in January, at the time of new strains being identified and a third new lockdown imposed, but it has begun to decrease again in recent weeks. Life satisfaction, sense of worthwhile and happiness were at their lowest during the third lockdown in January, in the depths of winter. But as spring emerges, the vaccination rollout continues apace and lockdown begins to ease, these measures are showing signs of improvement too.
While this data, as well as similar subjective wellbeing data that has been collected through the Covid Social Study, you gov polling, and Understanding Society, is fascinating and important just to track during this time of ongoing challenges and uncertainties to our lives, it also allows us to analyse what it is that is affecting us most. From understanding how the furlough scheme protected people’s mental health, to what helped us cope during this year. This data will continue to be a valuable asset to help us understand what works to improve, and hurt our wellbeing.
Interrogating the data and looking beyond the average
The volume of data collected systematically through the ONS’ Annual Population Survey has allowed us to go beyond the average to understand who may not be doing so well, looking for example specifically at people reporting low wellbeing, as well as the overall distribution of wellbeing outcomes in different parts of the UK. These questions and the associated results have made a major contribution to how we understand life in the UK.
By using self reported wellbeing as a ‘common currency’ and the ultimate goal for society that cuts across all policy areas, we can compare the wellbeing effects of very different things that happen to us, and use this data to inform the appraisal of future policies. The questions are also being increasingly used in evaluations that seek to measure how much interventions can improve wellbeing, with national data providing a valuable benchmark for comparisons.
This week, we are publishing the first in a set of factsheets that disaggregate the results from the latest waves of the Annual Population Survey data, from 2019 – 2020. These factsheets draw attention to the variation in subjective wellbeing between different people in different demographic groups, in terms of what the four different questions can tell us and where there have been changes in the distribution in the wake of the Covid-19 pandemic.
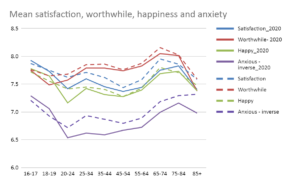
Our first factsheet looks at how wellbeing varies across age. The data identifies three different ages when we see average wellbeing dips according to different measures (supported by a regression analysis which controls for other other factors, such as health status).
We find that anxiety and unhappiness are troubling young people in the UK, while people in the midlife 45-55 age group have the lowest levels of overall life satisfaction. For people 85 and over, it’s the sense of purpose that takes a dive.
Stayed tuned for some more factsheets in the coming weeks and the ongoing data releases from the ONS that keep us up to date on how we are faring as lockdown eases and how well our wellbeing is recovering from the impacts of the past year.
Wellbeing and age
What does the Annual Population Survey tell us about the wellbeing of people of different ages?
Blog
![]()
[gravityform id=1 title=true description=true ajax=true tabindex=49]
Wellbeing and age
What does the Annual Population Survey tell us about the wellbeing of people of different ages?