Wellbeing in policy: exploring issues of measurement and methodology
Downloads
In partnership with


Introduction
The What Works Centre for Wellbeing promotes wellbeing as the ultimate goal of government. We develop and share robust and accessible evidence on what works to improve wellbeing, so that policies, programmes and projects can be designed and put in place in a way that can enhance wellbeing in the UK.
This is consistent with the UK Government approach to policy and spending decisions.
UK Government analysts use the guidance contained in the Green Book to consider the costs and benefits associated with any policy, in order to inform policy decision making. The Green Book now explicitly recognises the value of using wellbeing evidence to capture the direct and full range of impact of a policy. In practice however, the use of wellbeing evidence and measures in policy appraisal and analysis is still experimental and immature.
“Economic appraisal is based on the principles of welfare economics – that is, how the government can improve social welfare or wellbeing, referred to in the Green Book as social value.”
The Green Book: Central Government Guidance on Appraisal and Evaluation
This Working Paper is drawn from Frijters and Krekel [2], which is a broad publication that pulls together some of the history, frameworks, metrics, data and methodologies relating to the application of wellbeing evidence. It is intended for use primarily by policy analysts seeking to apply a practical wellbeing approach to policy appraisal and evaluation.
The What Works Centre for Wellbeing supports the authors’ view that wellbeing should become a systemic policy evaluation metric, based on wellbeing literature and incorporated in government’s guidelines and trainings. This will further the application of a wellbeing approach for daily policy-making in the UK.
This working paper focuses on three key insights from the work of Frijters and Krekel:
- Validity and practical application of subjective wellbeing measures
- How to structure a cost-effectiveness analysis for wellbeing
- Outstanding research questions
Validity and practical application of subjective wellbeing measures
“Wellbeing encompasses the environmental factors that affect us, and the experiences we have throughout our lives… our own capabilities as individuals; how we feel about ourselves; the quality of the relationships that we have with other people; and our sense of purpose…Beyond this, the wellbeing of a community or nation is more than the sum of how each individual in that place is feeling; it’s the relationships between people and institutions, social cohesion, integration, trust and social capital, as well as the quality and sustainability of the natural world.”
The reliable measurement of wellbeing is an essential prerequisite to understanding the variation in different communities and the impact of policies and programmes. There are now multiple validated measures that capture the different aspects and drivers of wellbeing, perhaps most notably the Measuring National Wellbeing Programme at the UK Office of National Statistics (ONS). The ONS programme measures 10 broad dimensions of wellbeing: the natural environment, our relationships, health, what we do, where we live, personal finance, the economy, education and skills, governance and personal wellbeing.
Personal wellbeing measures ask people to directly report their own subjective level of wellbeing. There are four subjective wellbeing questions included in the ONS personal wellbeing dimension. Included in this is a question asking people about their overall satisfaction with life. This is the primary direct measure of wellbeing at the individual level recommended by the UK Legatum Commission and the OECD.
“Overall, how satisfied are you with your life nowadays?”
Answer on a scale from zero (“not at all”) to ten (“completely”)
Question included in the ONS annual population survey
There are several benefits to using life satisfaction as the primary wellbeing metric for policy.
- Conceptual clarity: The measure concerns life as a whole, rather than identifying a specific aspect of wellbeing or moment in time and it asks people directly for their own self-assessment rather than presupposing what is important to people.
- Pragmatic: It is easy to explain with a clearly ordered set of answer categories.
- Supports and is supported by a growing evidence base: As an official ONS measure, it has been included in more than 40 datasets in the UK. There is a large and ever-expanding collection of data and research using the life satisfaction measure which we can use to test and compare different determinants of wellbeing. Evidence to date shows that individuals give answers to the life satisfaction question that relate intuitively to other measures of personal wellbeing, as well as our common sense predictions about the factors that might relate to, or determine, a person’s level of wellbeing. People that report higher wellbeing are generally:
- In employment
- Have good health
- Are partnered
- Have higher income
- Are at either end of the age spectrum
- Can be aggregated to measure population/lifetime wellbeing: The classical utilitarian approach to understanding the wellbeing of the population would be to sum up all the individual values of all citizens. Every individual counts equally and every point on the life satisfaction scale is equally valuable.
Similarly, lifetime values can be estimated by summing up the values in each year of life for any individual (with appropriate discounting of future years) into a ‘lifetime life satisfaction’ number. The basic unit of measurement then becomes Wellbeing-Adjusted Life Year (WELLBY), namely, a one-point change in life satisfaction for one person for one year.
As with any survey question, there are limitations that should be considered when using a life satisfaction measure and interpreting the data:
- Answers can be biased (unwittingly or intentionally) by the design of the questionnaires and the format of the surveys (for example by asking questions that prompt negative thoughts before asking about life satisfaction)
- As the change to overall life satisfaction from any one specific aspect of life is likely to be small, obtaining precise estimates of effects requires a large number of individuals.
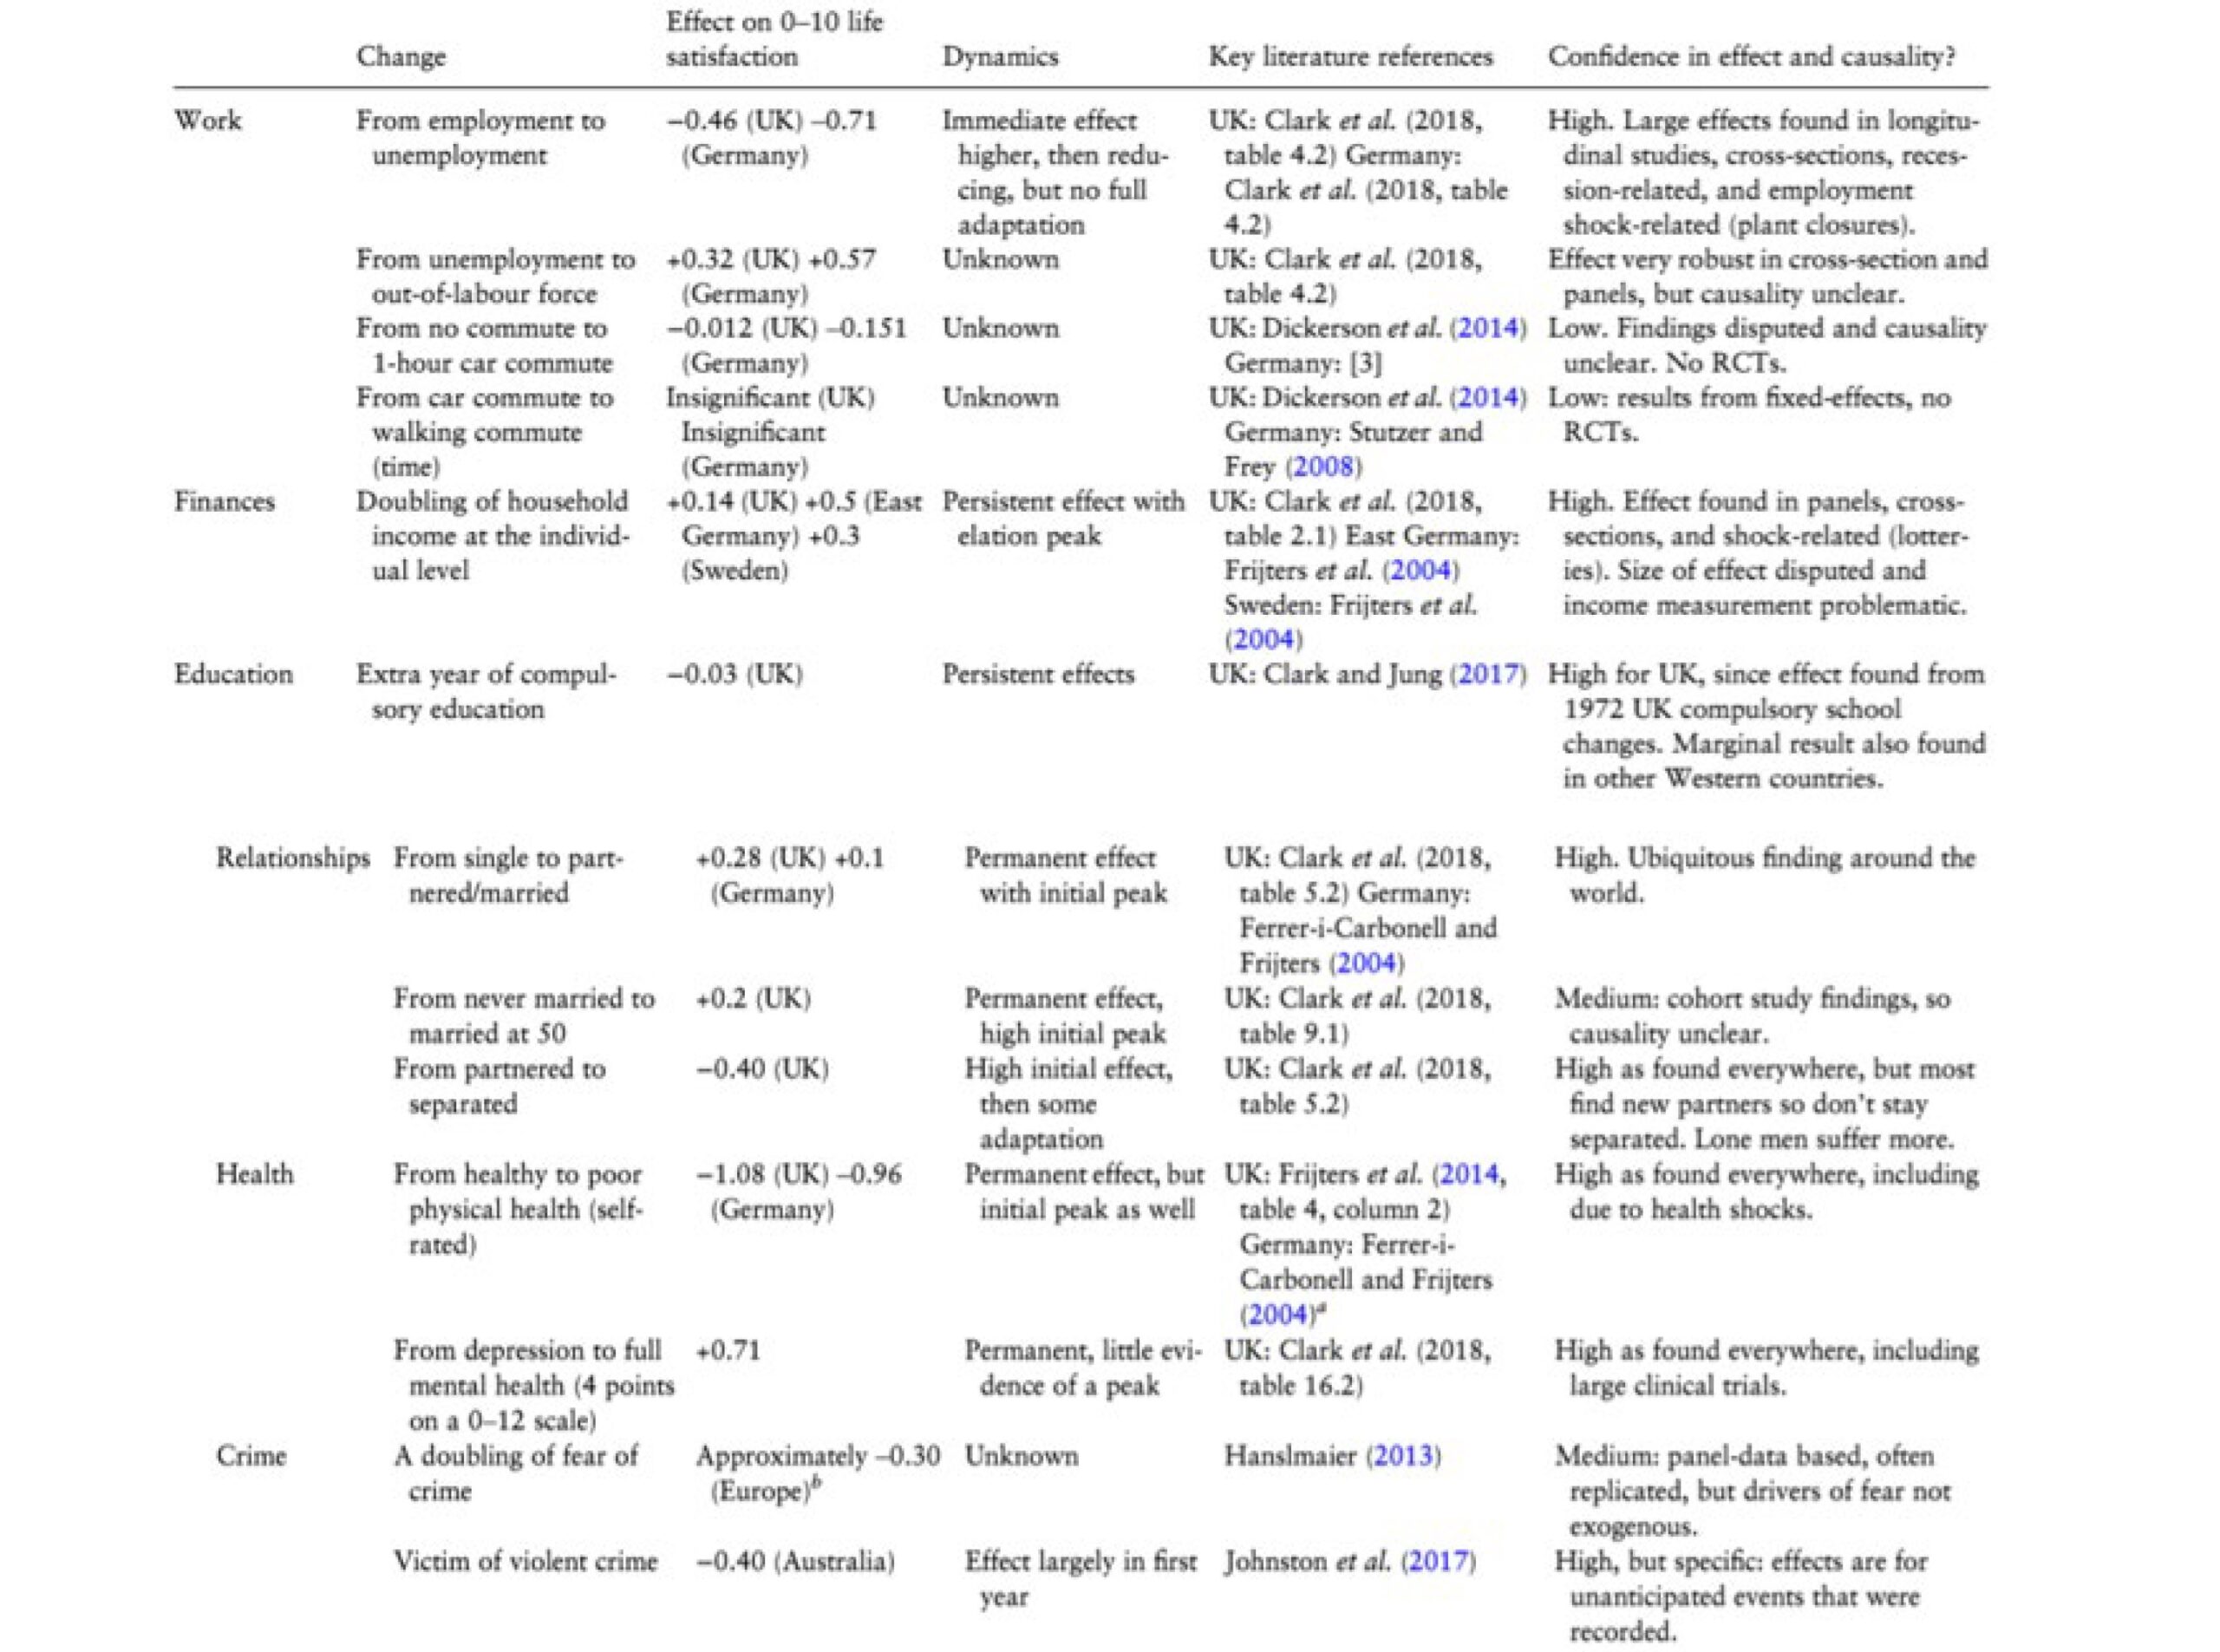
The identification of a single metric for measuring wellbeing enables policy makers to easily compare the impact of policies and investments that affect disparate aspects of our lives. Frijters and Krekel recommend that the UK Government commit to maintaining a list of policies and their associated changes in life satisfaction, as identified in the best available empirical studies.
They suggest that this should include the estimated size of the effect and the associated variation (standard deviation) of the relationship. Such a list could support the policy development process, by providing quantitative estimates for the effects of any given policy or investment and by comparing the overall effects of very different options.
Table 1 brings together some of the latest literature on life satisfaction from the UK and beyond. It attempts to identify the direction and size of the effect of different policies and circumstances on life satisfaction.
How to structure a cost-effectiveness analysis for wellbeing
“Economic appraisal… is where the expected costs and benefits of an intervention are estimated and the trade-off between costs and benefits is considered. This is referred to as Social Cost-Benefit Analysis (CBA) or, where appropriate, Social Cost-Effectiveness Analysis (CEA), which compares the costs of alternative ways of producing the same outputs”
The Green Book: Central Government Guidance on Appraisal and Evaluation
Deciding what policies to enact and how public funds should be spent in a way that is transparent, objective and evidence-based, is supported by well-designed appraisal and evaluation approaches. Guidance on how to compare diverse costs and benefits of UK Government policies is contained in the Central Government’s Green Book.
This presents options for conducting Social Cost-Benefit Analysis (CBA) and Cost-Effectiveness Analysis (CEA), both of which are concerned with the assessment of how the allocation of resources affects social welfare, or wellbeing.
Cost-Benefit Analysis: Converting wellbeing benefits to monetary values
The purpose of conducting a Cost-Benefit Analysis (CBA) for any prospective policy or investment is to maximise total value in a country, by comparing estimates of costs with estimates of benefits. When the benefits exceed the costs, value is created and the policy or investment is desirable.
To compare costs and benefits, all impacts are converted to comparable monetary values. Implicit in this is the translation of every effect into a consumption value, changes to either the price or quantity of goods and services consumed. For many goods and services, observable prices do not exist, for example, for environmental goods or air pollution.
The Green Book presents a hierarchy of the main techniques that can be used to estimate a price, which includes identifying people’s behaviour (revealed preference), asking people how much they would be prepared to pay for something (stated preference – willingness to pay), or using changes to direct wellbeing measures. This allows for changes in wellbeing to be included in existing CBA approaches.
Wellbeing
Use of direct wellbeing-based responses (in existing data or from research by questionnaire) to estimate relative prices of non-market goods.
The Green Book: Central Government Guidance on Appraisal and Evaluation
For changes in subjective wellbeing to be included in the main CBA, changes to direct wellbeing measures must be converted to monetary values. There are however conflicting estimates for how to convert changes in life satisfaction to money.
It is possible to derive a market value for wellbeing by comparing the levels of wellbeing of people with different incomes, or different house price values for example. In the literature, wellbeing regressions find the effect of income on individual subjective wellbeing to be positive, people with higher incomes have higher wellbeing, but the effect size is very small.
The same amount of money when won on the lottery has a larger effect, and the effect is larger still when looking at self-identified financial shocks. It is not straightforward to come up with a simple conversion factor between life satisfaction and a monetary value as the relationship between an individual’s money and life satisfaction is complex. Changes to life satisfaction will correspond to a change in income depending on an individual’s circumstances, particularly their starting income level and how that income was generated.
Furthermore, the wellbeing value of both income and many other inputs depends greatly on the visibility and awareness of these inputs, and more importantly, the income level of others in the local population or reference group. For example, any positive changes to an individual’s consumption beyond minimal levels is largely off-set by a negative comparison from others’ who as a result feel relatively poorer. As such, a change in one person’s income can affect the wellbeing of all others who are aware of this change. Wellbeing calculations will therefore need to discount part of the wellbeing effect on individuals from all forms of private consumption and private property, including visible investment goods like offices or land.
Discounting individual wellbeing benefits to account for externalities: The Easterlin Discount
The Easterlin Discount is the percentage of the consumption effect off-set by negative consumption externalities and can be applied to all measures of private consumption in any cost-benefit type of analysis to make a decision on how much of the individual benefit of additional resources to include as a social benefit.
The technical standard proposed is to discount all individual increases in additional consumption from additional economic activities by 75%, i.e. in principle, to only count 25% as an addition to the wellbeing of the UK. This estimate constitutes the part of the income effect that disappears when keeping relative income constant.
It is derived from Kapteyn et al.’s study of the various macro-factors that are important for life satisfaction based on World Gallup Poll data since 2008 in which the contribution of individual income reduces by around 75% if one also takes relative income (which is the income of the individual relative to the median household income) into account.
Thus, an estimated 75% of the effect of individual income is attributed to comparisons with others.
Frijters & Krekel, 2020
Even if a satisfactory conversion factor between income and wellbeing were to be applied, and a discount rate that took into account consumption externalities agreed, CBA in essence treats changes in wellbeing only as instrumental to the main decision-making criteria of minimising costs to the public purse and maximising economic benefits for government.
It implies that improvements in wellbeing are only worth investing in if they can be translated into a monetary value. If wellbeing evidence is to explicitly inform decision-making and shape policy priorities in the UK, it is necessary to weigh up all costs and benefits of key policy options with respect to how they affect overall wellbeing.
Wellbeing Cost-Effectiveness Analysis
In contrast to CBA in which both costs and benefits are expressed in monetary terms, Cost-Effectiveness Analysis (CEA) uses separate units of measurement for costs and benefits respectively, explicitly recognising that they cannot be expressed by the same metric.
For wellbeing CEA, the net public costs of a policy would be compared with the net benefits, which are expressed in terms of wellbeing.
Measuring costs
- Public costs include all the changes to the public purse, expressed as a monetary value, both positive and negative. Increased costs in any part of the system (for example, increased usage of health or education service, welfare benefits or tax avoidance) are positive costs. Additional tax receipts (money received by the government) due to a policy count as negative costs.
Measuring wellbeing benefits
- The net benefits of a policy include all the effects of a policy, both direct and indirect, and thus require a judgment as to what effects are important, who will be affected and how long the effects of a policy will last.
- Life satisfaction could be taken to be the main metric for measuring changes to the wellbeing of an individual.
- The Wellbeing-Adjusted Life Year (WELLBY), which aggregates changes to life satisfaction over time (direction of the effect) and population, can be used as the main unit of benefit to the UK (one unit of life-satisfaction for 1 individual on a 0-10 scale for 1 year).
Policies and spending would be evaluated and appraised by comparing the change in WELLBYs against costs to the public purse. Different policies could be compared and ranked based on this ratio. Comparing costs and wellbeing benefits can yield results that fall into one of four different categories for any given policy:
- Net cost and negative wellbeing change: such cases would never be considered eligible for funding.
- Money-saving and positive wellbeing change: such cases can generate cost savings from any policy (for example through delivering increases in productivity that are greater than the cost of implementing the policy), as well as delivering positive wellbeing changes.
- Positive cost and positive wellbeing change: such cases demonstrate how much it would cost to achieve a positive change in wellbeing.
- Money-saving and negative wellbeing change: generating cost savings may free up funds for interventions that have higher wellbeing benefits, which can offset any negative wellbeing change.
Most policies are likely to fall into category three, whereby there is some cost incurred to the public purse which is successful in delivering an improvement in wellbeing. In order to make a decision on which policies get funded, at its simplest application, CEA tells us that the policy that generates the most WELLBYs per £ would be the most cost effective and therefore should be prioritised.
In theory, any policy that delivers a positive wellbeing effect would be desirable, but as Government funds are limited, the challenge is to identify the point at which the investment in wellbeing is worth the money spent on it. This can be determined by whether the extra wellbeing a policy generated per £ passes a critical ratio, which ascertains whether it is value for money.
This critical ratio would be understood as the minimum amount of WELLBYs a unit of money is expected to buy. A higher ratio, which requires a greater increase in WELLBYs per unit of money, puts a higher threshold on what policies can be considered to be fundable. In practice, this threshold associates a change in wellbeing with a specific monetary value. It defines the minimum social cost acceptable for generating an increase in wellbeing.
“Wellbeing CEA yields an implicit monetary value of wellbeing given by the minimum social production cost of wellbeing: the last policy option funded that gives the implicit social cost… the social production costs of wellbeing may be an appropriate estimate of the monetary value of wellbeing itself.”
Frijters & Krekel, 2020
A logical starting point to identify what the minimum social production cost of wellbeing could be, would be to ask how much wellbeing NHS expenditure buys at the margin. This is because the NHS is a huge spending program with well-researched effects and costs that can be expressed as a cost-effectiveness ratio.
Health benefits are currently measured by the Quality Adjusted Life Year (QALY). This uses surveys to measure five dimensions of subjective health; mobility, ability to care for self, ability to engage in usual activities, pain/discomfort, and anxiety/depression.13 A QALY of 1 relates to top answers to all these 5 health dimensions while a QALY of 0 has been derived by asking individuals hypothetical trade-offs between more years in one health condition versus less years of life in a better health condition.
Claxton et al.14 estimate that in the NHS at present, widely available operations buy a QALY at the price of around £12,936. This estimate has been instrumental in the Department for Health (DH) estimating that it can produce a QALY via the NHS for £15,000. This could be either via improvements in the quality (health) or in the length of life.
This figure can then be used to arrive at the social production costs of a WELLBY if we can associate a change in QALY to a change in wellbeing.
From QALYs to WELLBYs
The average life satisfaction responses in the UK of someone in self-declared ‘excellent’ health was 5.88 on a 1-7 scale in Wave 8 (2016-2018) and 5.85 in wave 7 (2015-2017) of the Understanding Society dataset.
If we translate this to the ONS 0-10 scale using the response formulas of Parducci (1995), also discussed in Van Praag and Frijters (1999), we find the UK life-satisfaction on the ONS scale of those in excellent health is 7.95 and 7.91 respectively in these periods and above the average life satisfaction of the whole population, which is around 7.8 in 2019.Using the rule of thumb that average life satisfaction for people in excellent health (a QALY of 1) is an 8 on the life satisfaction scale, whilst 2 is the life-satisfaction level deemed equivalent to death and thus a QALY of 0, 1 QALY (an extra year of life expectancy) is therefore worth approximately 6 WELLBYs.
Frijters & Krekel, 2020
Based on the calculations in Frijters and Krekel, an extra year of life expectancy in good health (1 QALY) can be understood to be worth 6 WELLBYs. Thus, based on the Department of Health’s current assumption that 1 QALY can be produced for £15,000, this would translate to £2,500 per WELLBY. Therefore, a minimum marginal social cost of producing a WELLBY within the NHS is arguably around £2,500 per WELLBY. On this basis, policies and investments that deliver more than 1 WELLBY for every £2,500 are worth the cost incurred.
Developing a wellbeing Cost-Effectiveness Analysis model
Frijters & Krekel recommend the use of life satisfaction as the single metric to measure changes in an individual’s wellbeing. However, even using a single metric they are clear that the factors that can affect this metric are diverse, including both direct experiences on targeted individuals and indirect effects on associated people or populations. Effects can happen at different points in time and have varying durations depending on the group.
To provide a full account of wellbeing effects the approach needs to take into account all effects across groups in a way that draws on the literature of the expected quantitative effects of different factors. [See table 1].
The authors describe a step-by-step approach which can help to generate a thorough Cost- Effectiveness model, which can be understood in three parts:
1 – Identify and estimate all effects on wellbeing from the policy
- Identify the different people and groups affected by the policy. Distinguish between those directly affected, those close to the directly affected, and the general population. Wellbeing CEA recognises the broader impact of policies targeted towards specific groups. It should explicitly take into account the externalities or “status effects” (where people compare themselves with others) from any change to an individual’s wellbeing that have an impact on the wider population.
- For each of these groups, write down the five most important pathways one expects for wellbeing benefits to arise from the policy or change. There are many diverse drivers of wellbeing that could arise from any given policy, affecting different aspects of our lives. Each of these drivers should be included. It is important that each pathway is distinct, so that you do not double count effects, but identify additional effects [See double counting in part 3].
- Obtain causal effects for these pathways: wellbeing evidence can provide estimates for the effect size for different pathways, so that the effect from each separate pathway can be quantified.
- Identify the expected timings for these effects, specifying what time period the changes to wellbeing occur and how long those changes last.
2 – Identify and estimate all costs (positive and negative) from the policy
- Identifying direct costs associated with the policy as well as indirect costs that occur from policy take-up. These could be positive (expenditure) or negative (savings).
- Estimate the time period these costs are likely to occur and their duration.
3 – Test and refine the Wellbeing Cost-Effectiveness model
- Repeat parts 1 and 2 until a coherent story regarding main effects, externalities, population-wide effects, and costs crystallises.
- Obtain feedback from experts and redo steps one to six if necessary.
- Evaluate the impact of the policy ex-post to find out its true effects.
Outstanding research questions
This paper has described the basic components of a wellbeing CEA as presented by Frijters & Krekel, including a recommendation for the WELLBY to be the standard measure of benefit. This approach can be used to compare diverse policies in order to achieve an overall welfare gain for the UK.
While life satisfaction may constitute a reasonably accurate measure, the question of which summary wellbeing measure to adopt for policy decision-making should remain open to debate. Discussion should include the search for more fine-grained supplementary measures capable of picking up small effects or effects of specific populations in as precise a manner as possible.
In addition, the authors highlight several questions that remain unanswered when implementing this approach in practice. This section outlines some of the key questions which require further development and clarification for wellbeing CEA to be applied consistently in decision making.
Valuing different effects on different groups: Should more weight be given to changes (up or down) in the wellbeing of people whose wellbeing is currently low? If so, how much extra weight should be given? One approach is to ask the population what they think about the weighting. Here, sensitivity analysis can be used to assess what difference (if any) is made when different weightings are applied.
Valuing effects over time: To take account of the full effects on wellbeing, we not only care about how individuals think about their lives in the “here and now” but also about how they will think about them in the future. For most individuals, the effects of a policy change are spread over a number of years. Some policies affect people not yet born.
In traditional CBA, any future monetary benefits are discounted on two counts. The first (the ‘social discount rate’) reflects the general uncertainty about the future and the degree to which the future matters less than the present; the second reflects the assumption that future generations will be richer and therefore have a lower marginal utility of income. In the current UK Treasury’s Green Book, the first element is put at 1.5% per annum and the second at 2%.
When measurements are in units of life satisfaction, the declining marginal utility of income ceases to be relevant. It is not straightforward to determine whether different values should be given to the wellbeing of different generations, or in fact different years of one person’s life, particularly where there are explicit trade-offs. For example, a policy could reduce wellbeing today in order to reap wider wellbeing improvements in future years.
There is no clear solution to this problem, and where the effect is substantial it must be shown explicitly in the analysis. Where it is not, the pure time discount rate of 1.5% may suffice.
Valuing length of life: Most people would agree that a longer life is better, but so is a happier one. To take both elements into account, the most common approach is to multiply the person’s length of life by their average wellbeing – so that the result equals the total wellbeing the person experiences over their lifetime.
Aggregating this up to the population level, new-borns, the deceased and those yet to migrate to the UK, can also be included in population estimates. Frijters & Krekel point to research that finds that individuals are willing to trade off more years of life at very low levels of life satisfaction for fewer years with higher levels of life satisfaction.
This implies that very low levels of life satisfaction, a score below two on the life satisfaction’s 0-10 scale, is a state worse than death. This is consistent with the QALY scale, which can go below 0, recognising that there are health states worse than death.
Double counting wellbeing effects: For full accounting of all effects on wellbeing, a cost-effectiveness model is likely to identify several different pathways where a policy can affect wellbeing. For example, a policy which is effective in moving someone from unemployment to employment is likely to improve their wellbeing through both an increase in income and a decrease in anxiety.
However, if two pathways are related, for example where the decrease in anxiety is due to having better financial security, separate effects cannot simply be added up. This would constitute double-counting, as one pathway contains an element of the other.
In an ideal scenario, randomised controlled trials would test the overall wellbeing effect (change in life satisfaction) of a specific policy. In practice the main pathway that is expected to affect wellbeing and any secondary pathways related to it should be identified. If pathways are understood to be completely independent of each other, they should be added in.
Where they are conditional upon each other, the effect (of any secondary pathways) should be examined for its additional contribution only. This is the equivalent of holding the primary pathway constant in a regression analysis framework. A conservative approach, therefore, would not account for additional pathways if there is a likelihood that they are already included in other pathways. Careful consideration of the potential for double counting and direct and indirect costs should also be applied.
Accounting for externalities: Because of the importance of ‘status effects’, policies that have a positive impact on the wellbeing of a targeted individual, can be off-set by a negative impact on others. Therefore, wellbeing calculations will, by default, discount part of the wellbeing effect on individuals in order to take into account the effect on the wider population and decisions need to be made about what value to apply.
This Working Paper draws on the research conducted as part of the Economic and Social Research Council and the What Works Centre for Wellbeing’s Cross-Cutting Capabilities programme. The research programme is led by Paul Frijters at the London School of Economics and Political Sciences. The working paper is produced by Margherita Musella, Evaluation Lead at the What Works Centre for Wellbeing in collaboration with Frijters & Krekel.
It is based on Frijters, P., and Krekel, C. (2020). Handbook for Wellbeing Policy-Making: History, Theory, Measurement, Implementation, and Examples. Mimeo
Downloads
![]()
[gravityform id=1 title=true description=true ajax=true tabindex=49]