Learnings from time use data 2020-2021
Following the recent revision of the UK’s Wellbeing Framework by the Office for National Statistics, ‘Satisfaction with time use’ is a new measure that is under development and will be included in future updates.
Here, Research Fellow Elena Mylona discusses what existing time use data can tell us about wellbeing, summarising insights and outputs from our newly launched analysis conducted in partnership with University College London’s Centre for Time Use Research.
The work explores UK time use data from 2020-2021 to understand how people use their time, respond to external changes, and how this impacts their own wellbeing and that of the wider society. It was supported by the Economic and Social Research Council and forms part of our work to accelerate access to wellbeing datasets.
What is time use?
Time use data capture how people choose to spend their time, who they spend it with, and how they feel about it. This allows researchers to explore the complex relationships between different outcomes and activity types and durations, enjoyment levels, location, and co-presence.
At a granular level, time use studies help us understand what activities people do week-to-week, or day-to-day, and how much enjoyment they take from what they engage in. In this way we can observe and measure the contribution of daily experiences to an individual’s subjective wellbeing. Time use data also enable us to study sequences of activities to better explore concepts such as tiredness and leisure.
Time use, wellbeing and Covid-19
To understand the relationship between life satisfaction and overall daily activity enjoyment, we analysed UK data from waves 2-6 of the CTUR UK Time Use Survey 6-Wave Sequence across the COVID-19 Pandemic, 2016-2021 dataset using linear regression models.
This dataset enabled us to see behavioural change over lockdown restrictions, and two intervening periods where restrictions were eased; allowing us to explore what impact, if any, lockdowns might have on the relationship between instantaneous enjoyment and life satisfaction.
Key insights
We found:
- The higher the daily mean activity enjoyment, the higher the reporting of overall life satisfaction.
- The trend was similar for both lockdown and non-lockdown conditions.
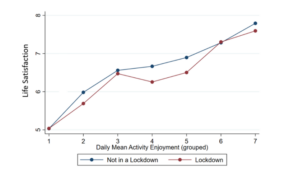
Predicting life satisfaction, by daily enjoyment and lockdowns/easing of restrictions
- Higher values of satisfaction and enjoyment were predicted for individuals aged 61 and over, compared with lower age groups. These results are not unusual, in general older people report higher levels of wellbeing than younger age groups. This could be due to differing perceptions of wellbeing.
- During a lockdown, males reported higher levels of overall life satisfaction than women. This may be the result of the increase in women’s unpaid domestic and care workload during school closures and when restrictions were put in place.
Read the full report for further details and to view additional graphs on sex and age.
What do the findings mean in practice?
How we spend our time and how much we enjoy our daily activities affects our mood and this impacts our life satisfaction. Understanding this relationship is particularly useful for:
- Designing services
- Understanding how workplace systems impact wellbeing at work, increasing the range of options for workplace wellbeing
- Understanding where wellbeing might be impacted for different population groups, as either a risk or problem solving solutions
Insights from time use data can be used to inform new policies designed to enhance lifestyle-related welfare in the population, such as:
- The effectiveness of flexible working arrangements
- Service design and delivery, including digital
- Childcare provision
- Long-term mental and physical health
Opportunities for further wellbeing research using time use data
As time diaries provide a detailed deconstruction of our daily lives, future research could:
- Explore whether an individual’s enjoyment during working hours changes and, if so, investigate how and why
- See what time points during the day, or which activities, impact people’s enjoyment
- Record Subjective wellbeing alongside organisational measures of productivity to further investigate this relationship. Any findings could inform job design and HR policies
Time diary data, like the CTRU Time Use Survey, also capture information on co-presence – who people are spending their time with. Future research could use this to understand the impact of activity types, frequency and co-presence on the level of reported loneliness. For example, are those who report feeling loneliness spend the majority of their day alone?
Data and methods
The CTUR UK Time Use Survey uses the online Click and Drag Diary Instrument (CaDDI), asking respondents to record their activities (primary and secondary), location, co-presence, device use, and enjoyment level, using 10-minute episodes throughout the diary day. Participants were also asked to complete a survey questionnaire, including sociodemographic, health and time use related questions. An additional set of survey questions were added from Wave 2 onward, including the ‘ONS4’ wellbeing questions. Find an example of how the CaDDI instrument is completed.
All waves of the CaDDI data are free and available to download from the UK Data Service, available to academic and non-academic users, upon acceptance of the terms and conditions.
In CaDDI, respondents use a scale of 1-7, where 1 is ‘least enjoyable activity’ and 7 is ‘most enjoyable activity’, to select for every activity each day. A ‘daily mean activity enjoyment’ score is then calculated by taking an average for the day. Find guidance on how to construct these variables.
Time diaries – digital or physical – are the most commonly used data collection method in time use research. They are typically collected over a 24-hour period in 10 or 15 minute slots. They have been validated against simultaneous body-camera and accelerometer records, suggesting they are highly accurate and less likely to include response errors or socially desirable answers when compared to survey questionnaires.
Advancements in technology and user-friendly instruments have made completing time diaries easier for participants, reducing the respondent burden.
Accelerating access to data and syntax available
We have produced accompanying guidance on how to create a set of variables using time use data, collected using the CaDDI instrument. You can find free-to-use Stata syntax for data management and cleaning for the CaDDI data in our data usage library on GitHub. These can also act as a guide to analyse other time diary studies.
Find out more
Blog
![]()
[gravityform id=1 title=true description=true ajax=true tabindex=49]