Measuring progress: what the November 2022 ONS quarterly release tells us
In this week’s blog, we look at the Office for National Statistics’ (ONS) most recent quarterly wellbeing dashboard publication.
A full account of our national wellbeing covers the economic, social and environment aspects of our life in the UK. The ONS now publishes a quarterly Measures of National Well-being Dashboard: Quality of Life in the UK alongside GDP and climate statistics.
These objective and subjective measures are used as part of the wellbeing framework to measure societal progress in the UK and track the future sustainability of national wellbeing.
As a backdrop to the Chancellor’s November statement today, we look at what the latest ONS release tells us about wellbeing in the UK, analysing the four subjective wellbeing measures (ONS4): anxiety, life satisfaction, purpose and happiness. These are indicators of whether people across the UK are living happy and fulfilling lives (Levelling Up Mission 8).
Anxiety – Negative Affect
Looking at the trends over the past 11 years, we can see a fall in low levels of anxiety and a rise in high levels of anxiety that correspond to the Covid-19 pandemic and UK lockdown periods. Trends have improved since the Covid-19 outbreak, but have not returned to pre-pandemic levels (figure 1).
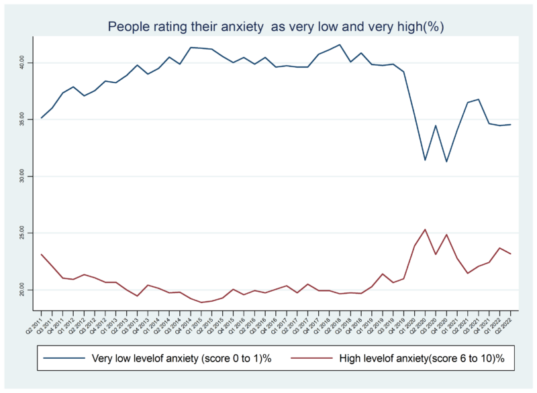
Fig. 1 – percentage of people reporting low and high anxiety 2011-2022
Looking specifically at Q2 2022, we can see that older people, aged 50 and over, are more likely to report very low anxiety scores than younger people(figure 2).
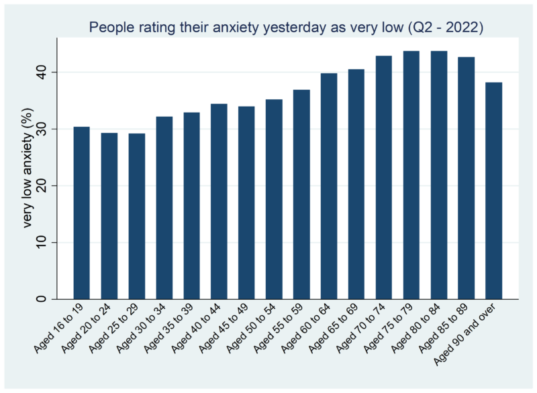
Fig. 2 – percentage of people with low anxiety by age for Q2 2022
Life satisfaction
Similar to anxiety, looking at trends over time, the proportion of respondents reporting high levels of life satisfaction fell and there was a peak in reported low levels of life satisfaction, which align with the height of the pandemic measures (figure 3).
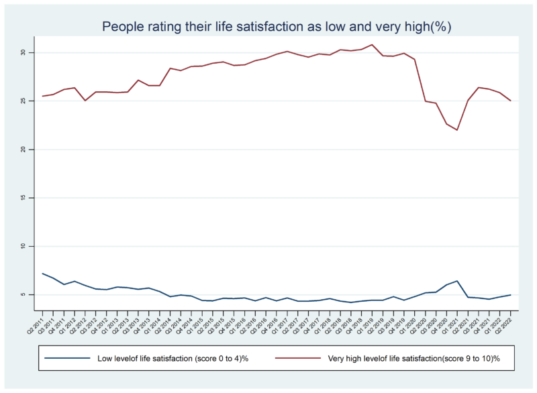
Fig. 3 – percentage of people reporting low and high life satisfaction 2011-2022
Looking at age groups, those between 40 and 55 years have the smallest percentages of high life satisfaction’s scores in Q2 2022 (figure 4). This is in keeping with previously established trends.
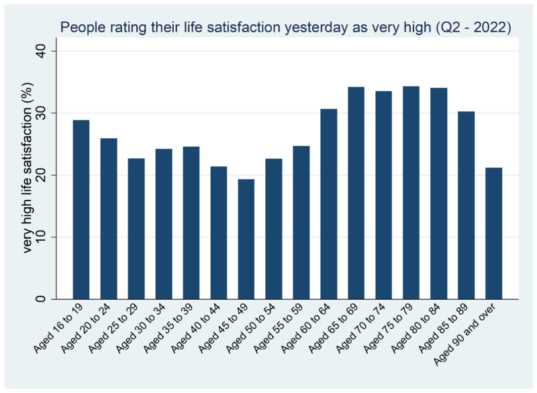
Fig. 4 – percentage of people reporting high life satisfaction Q2 2022
Happiness and a sense that things in life are worthwhile
There is a less pronounced trend over time with happiness and purpose in comparison to life satisfaction and anxiety. However, we do see a noticeable drop in the responses corresponding to high values, those reporting very high levels of happiness or that they feel the things they do in life are very worthwhile. The percentages corresponding to low scores of worthwhile remain quite stable (figure 5 and figure 6).
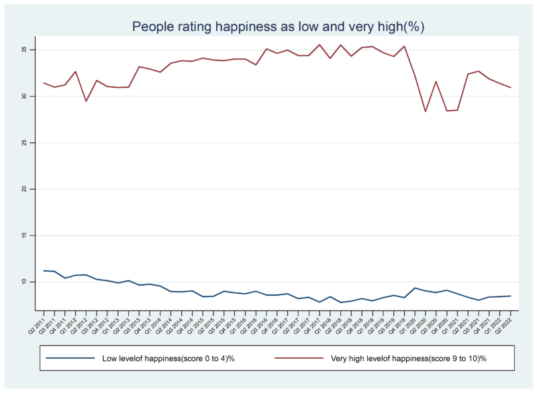
Fig. 5 – percentage of people reporting low and high happiness 2011-2022
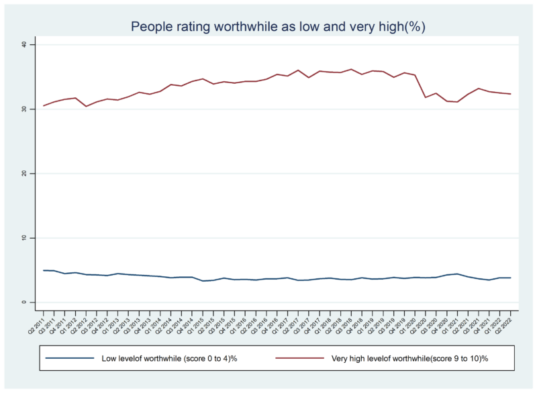
Fig. 6 – percentage of people reporting low and high purpose 2011-2022
Looking at Q2 2022 by age, 20-29 years and 40-49 years have the lowest percentages of high happiness scores (figure 7 and figure 8). This reflects what we know: life satisfaction peaks at 23 and 68 and is at its lowest during working life.
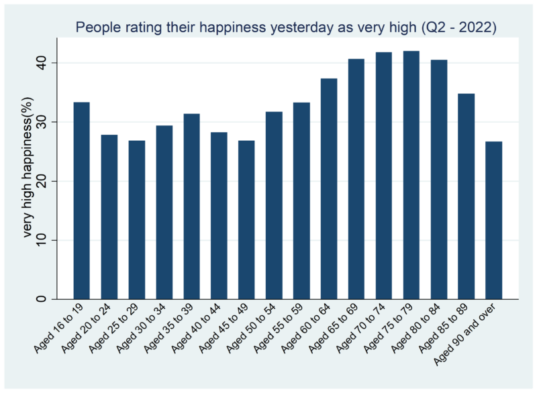
Fig. 7 – percentage of people by age reporting high happiness Q2 2022

Fig. 8 – percentage of people by age reporting high purpose Q2 2022
Analysis by sex
Women are reporting more variation with these measures. If we analyse the Q2 data by sex, we can see that women experience more very high and very low emotions overall, with a higher percentage reporting very high happiness, worthwhile and life satisfaction (figure 9). Women are less likely to report low anxiety, while more men report very low anxiety.

Fig. 9 – percentage of women and men rating anxiety as low, and life satisfaction, happiness and purpose as high Q2 2022
These insights mirror findings from our previous analysis of ONS Annual Population Survey (APS) data. When controlling for factors that affect wellbeing, such as self reported health and employment status, women reported higher satisfaction with life and a higher sense of purpose (worthwhile). Women also reported higher anxiety (APS data March 2019-March 2020), and during the Covid-19 pandemic women experienced a greater increase in anxiety compared with men (APS data April – September 2020).
Moving beyond Averages: Using the quarterly data
By using the quarterly APS data, we can look in more detail at the short and long-term variations in subjective wellbeing by time and by age group.
We can compare quarters within a year and across years, to give us a clearer picture beyond national yearly averages. We can also compare the subjective wellbeing data with economic wellbeing estimates, such as GDP, which use quarterly data for their indicators.
The reporting of change over time supports evaluation of the UK’s progress and future sustainability of national wellbeing.
Explore the data using the ONS interactive tool, and have your say on the national wellbeing framework through the ONS public consultation.
If you want to use this data in your policy making, look at our Green Book guidance and future training opportunities.
Methodology
Individual subjective wellbeing is central to understanding national wellbeing. ONS captures these insights by measuring individuals’ positive and negative emotions, satisfaction with life, and whether they feel the things they do are worthwhile. These measures are referred to as the ONS4.
The above analysis uses quarterly APS data seasonally adjusted from Q2 2011 to Q2 2022. Data for age groups are for Q2 2022 only.
Quarterly data are generated from the APS by dividing the annual dataset into four quarterly datasets. Each quarterly dataset was then weighted to reflect the size and composition of the general population, by using the most up-to-date official population data.
Blog
![]()
[gravityform id=1 title=true description=true ajax=true tabindex=49]