ONS Wellbeing dataset and personal Wellbeing data releases
Earlier this year ONS released analysis combining the first three years of UK personal wellbeing statistics.
The Personal Well-being dataset makes it easy to see how one Local Authority area in the UK compares with another.
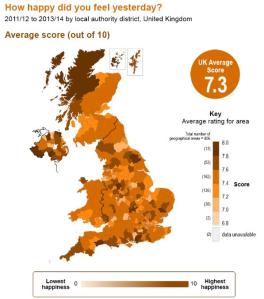
Interactive maps were also released at the same time which provide another interesting and straightforward way to explore the findings for different areas.
→Local Authority District (LAD) level maps (static and interative)  showing results from the 4 subjective wellbeing questions
This powerful 3 year dataset also enables us to look more closely at the well-being of many specific groups, such as disabled people, minority ethnic groups, people who report an affiliation to different religions, and people who rate their health as good or poor.
For those with a particular interest in health, the data is available for Health and Wellbeing Boards areas and Clinical Commissioning Groups as well.
For economists and those interested in local economic development, the data can also be analysed for Local Enterprise Partnership areas as well as for local authorities.
→Excel tables with figures for a range of sub-groups and geographical areas
To help meet policy needs for regularly updated statistics on personal wellbeing, ONS will continue to publish the annual personal well-being statistics, analysis and dataset each September. Every year, a dataset combining the previous 3 years of results will also be published to enable more a more detailed look at what’s happening to the well-being of different groups and in different areas of the UK.
Two newly released publications on personal well-being from ONS:
 Taking a wider view on personal wellbeing the European Social Survey has also published their results on Europeans’ personal and social wellbeing
