Measuring progress and quality of life in the UK: February 2023
As a Centre we support the appropriate and consistent use of harmonised measures to understand national wellbeing.
Here, we look at the Office for National Statistics’ (ONS) most recent Measures of National Well-being Dashboard: Quality of Life in the UK quarterly publication and discuss what the latest release tells us about wellbeing in the UK.
Human Wellbeing: Mission 8 Levelling Up
The ONS’ 10 February 2023 release provides an update on 26 of the 44 indicators across 10 domains of national wellbeing, using the latest data available as of 25 January 2023. These are indicators of whether people across the UK are living happy and fulfilling lives.
The national wellbeing indicators come from several data sources with different geographical coverage and data collection periods. Access the data set.
The latest publication includes updated insights from the four indicators of individual subjective wellbeing (ONS4) for July to September 2022 (Quarter 3):
- 30.5% of adults in the UK reported very high levels of happiness. This has decreased compared with 33.6% in Quarter 3 2021, and 35.24% in Quarter 3 2017, showing a short and long-term deterioration.
- 35.4% of adults in the UK reported very low levels of anxiety. This is similar to 37.17% in Quarter 3 2021, but worse than Quarter 3 2017 (40.1%).
- 24.2% of adults in the UK reported very high levels of life satisfaction. This has decreased compared with 26.8% in Quarter 3 2021 and 29.69% in Quarter 3 2017, showing a short and long-term deterioration.
- 31.7% of adults in the UK reported very high levels of feeling things they do in life are worthwhile. This is similar to 33.7% in Quarter 3 2021, but worse than Quarter 3 2017 (35.9%).
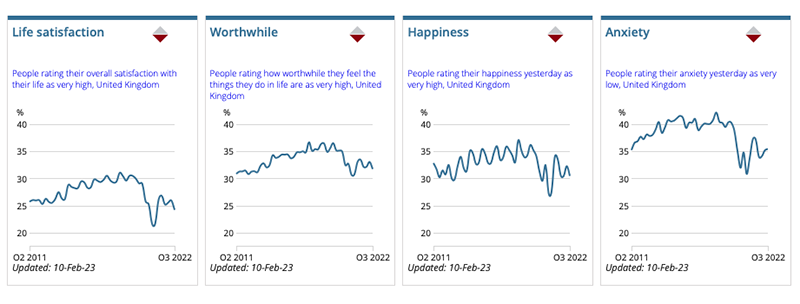
Source: ONS ‘Measures of National Well-being Dashboard’ quarterly release, 10 February 2023
For more information about the ONS4, see our rapid evidence assessment of impact evaluations that use the personal subjective wellbeing measures. This was the first of its kind and part of our work to systematically identify and summarise evidence from evaluations that use wellbeing frameworks and standardised measures.
Further insights
The ONS uses objective and subjective measures as part of the wellbeing framework to measure societal progress in the UK and track the future sustainability of national wellbeing.
Human Capital
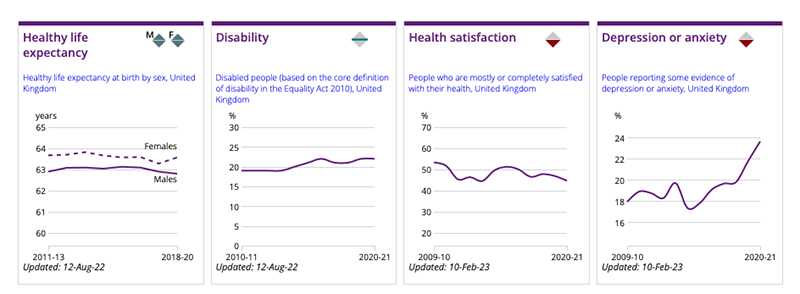
- Health – 44.7% of adults in the UK were mostly or completely satisfied with their health between January 2020 and December 2021. This has decreased from 51.3% in 2015-16.
- Education and skills – 10% of 16 to 24 year olds were not in education, employment or training and 6.9% had no qualifications as of July to September 2022.
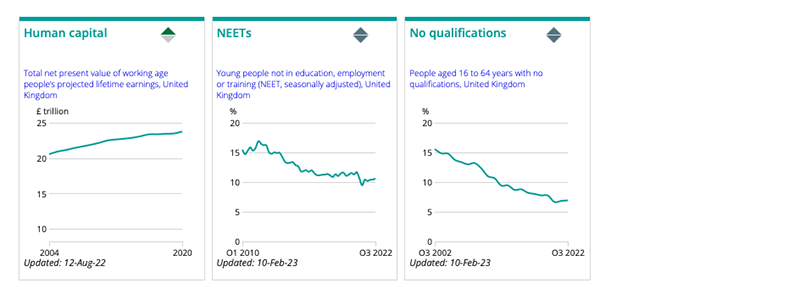
Source: ONS ‘Measures of National Well-being Dashboard’ quarterly release, 10 February 2023
Social Capital
- Social support – 87.7% of UK adults reported that they can rely on people in their lives if they have a serious problem (January 2023).
- Trust in others – 66.4% of UK adults said that, in general, they trust most people (January 2023).
- Belonging – 54.8% of UK adults agreed or strongly agreed that they felt like they belong to their neighbourhood (January 2023).
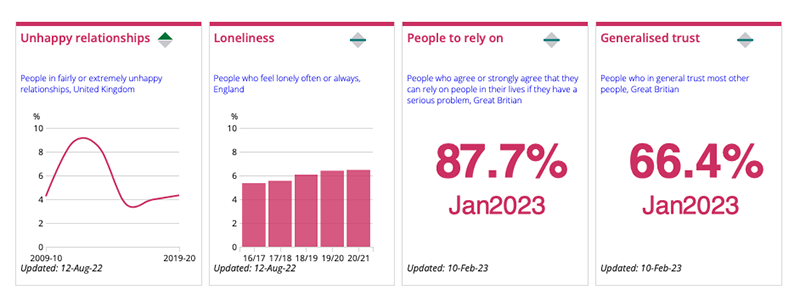
Source: ONS ‘Measures of National Well-being Dashboard’ quarterly release, 10 February 2023
Having someone to rely on and levels of trust are two of the six indicators of high wellbeing nations.
To build the evidence base on community wellbeing and social capital we brought together what is known about improving neighbourhood belonging, social support and community cohesion in a rapid evidence review. The review also promotes the use of harmonised social capital measures to ensure wellbeing evidence is increasingly consistent, robust and useful.
Economic Capital
- The economy – the inflation rate was estimated at 9.2% in December 2022.
- Income satisfaction – 45.1% of UK adults agreed or strongly agreed they were satisfied with their household income in 2020-21.
- Personal finance – 6.61% of UK adults reported finding it quite or very difficult to manage financially. This is similar to 2015-16 and 2019-2020.

Source: ONS ‘Measures of National Well-being Dashboard’ quarterly release, 10 February 2023
Civic Strength
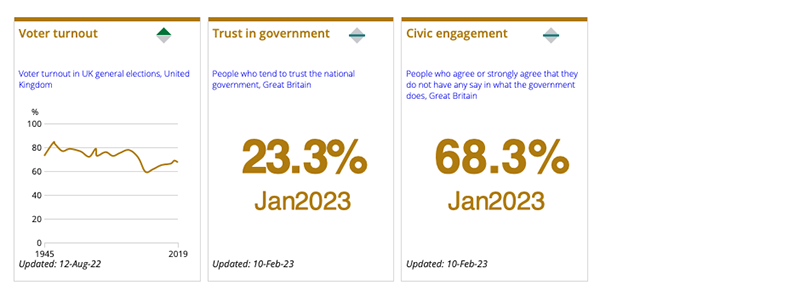
- Trust in government – 23.3% of UK adults reported they trust the government. This is a new metric.
- Autonomy – 68.3% of adults agreed or strongly agreed that they do not have any say in what the government does. We know that having control over your decisions is crucial to wellbeing.
Perceptions of governance are related to disparities in subjective wellbeing.
Source: ONS ‘Measures of National Well-being Dashboard’ quarterly release, 10 February 2023
What we do
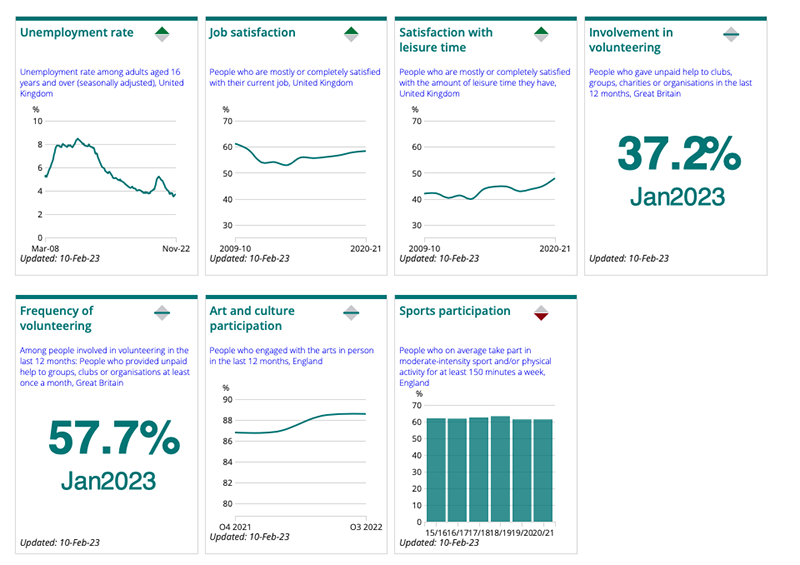
- Employment – unemployment rate was 3.7% for September to November 2022, the same as the same period in 2021. From our systematic review on unemployment we know that being out of work is damaging to people’s wellbeing regardless of their age, gender, level of education, ethnicity or part of the country in which they live. The longer the time unemployed, the worse the effect.
- Job satisfaction – Over half of UK adults were mostly or completely satisfied with their job (59.7%) between January 2020 and December 2021, an increase since 2015-16 (55.6%).
- Volunteering – 37.2% of UK adults reported volunteering at least once in the past 12 months (January 2023), an increase from 29.5% in June to July 2022. Of those, 55.7% reported volunteering at least once a month. Our review of volunteering evidence found that volunteering is associated with enhanced wellbeing, including improved life satisfaction, increased happiness and decreases in symptoms of depression.
Source: ONS ‘Measures of National Well-being Dashboard’ quarterly release, 10 February 2023
Using the quarterly data
By using the quarterly data, we can look in more detail at the short and long-term variations in subjective wellbeing by time and by age group. We can also compare quarters within a year and across years, to give us a clearer picture beyond national yearly averages. We can also compare the subjective wellbeing data with economic wellbeing estimates, such as GDP, which use quarterly data for their indicators.
“Bringing this together quarterly reflects our interconnected economy, environment and society. We know, for example, that time spent in nature can be good for our mental wellbeing and our physical health; housing is more desirable if it is close to green spaces; and, to have a sustainable economy we must take care of our environmental assets.” – Liz McKeown, Director of Public Policy Analysis, ONS
What you can do
- Explore the data further using the ONS interactive tool.
- Use these measures in your policy making in line with HM Treasury Green Book guidance and look for our future training opportunities.
- Explore Wellbeing Evidence at the Heart of Policy for the big picture.
- Read Paul Allin’s discussion paper on The role and use of official statistics in measuring wellbeing.
- Learn more about how we’re accelerating access to wellbeing datasets.
See our work to maximise local area wellbeing for guidance and examples on how to use wellbeing data at a local government level.
Reviewing the framework
On 3 October 2022, ONS launched a review of the Office for National Statistics’ Measures of National Well-being. The recommendations from this consultation will be published in Spring 2023.
See the Response summary: Review of the Measures of National Well-being for more information.
Blog
![]()
[gravityform id=1 title=true description=true ajax=true tabindex=49]