Using ONS data to measure progress and quality of life in the UK. Learnings from February 2024
Since the Centre’s foundation in 2014, we’ve used the rich and growing data produced by the Office for National Statistics (ONS) Measures of National Well-being Dashboard in our research and analysis, and supported others to use it to better understand national wellbeing.
Here, we look at its February 2024 publication, discuss what some of the new indicators tell us about wellbeing in the UK, and explore using national data.
The National Measure Wellbeing Programme began in the UK in 2011, following a public consultation on what matters most to people. In response and following the Commission on Wellbeing and Policy, the Centre was established. The programme developed a national wellbeing framework and has been reporting on wellbeing measures in their dashboard for over 10 years.
Last year, we contributed our expertise to the first ever review of the national framework, to help shape and understand the future of wellbeing measurement. As a result of the review, additional dimensions of wellbeing were captured, through the development of 12 new measures.
Insights from February 2024
In November 2023, data from updated measures were published for the first time. We analysed five new measures, including Hope and Fairness, as well as ONS4 indicators – examining trends and differences based on characteristics such as age and sex. See our previous analysis.
In the latest quarterly publication new data is available on both existing and newer measures. This time we focus on:
- Satisfaction with services.
- Satisfaction with social relationships and community.
- Satisfaction with personal circumstances.
- ONS4 indicators: life satisfaction, worthwhileness, happiness and anxiety.
Highlights from new measures
Many of the newer measures are ratings of how satisfied individuals are with different aspects of their life and environment. Overall, satisfaction with public services is lower than satisfaction with personal areas of life, such as relationships.
Satisfaction with services or systems
| Service area | Percentage who tend to be satisfied |
|---|---|
| Healthcare system | 53.8% |
| Police | 49.8% |
| Education System | 48.4% |
| Courts and legal system | 35.2% |
When it comes to differences based on age:
- Older people seem to be more satisfied with the healthcare system and the police.
- Younger people seem more satisfied with the education system and the legal system.
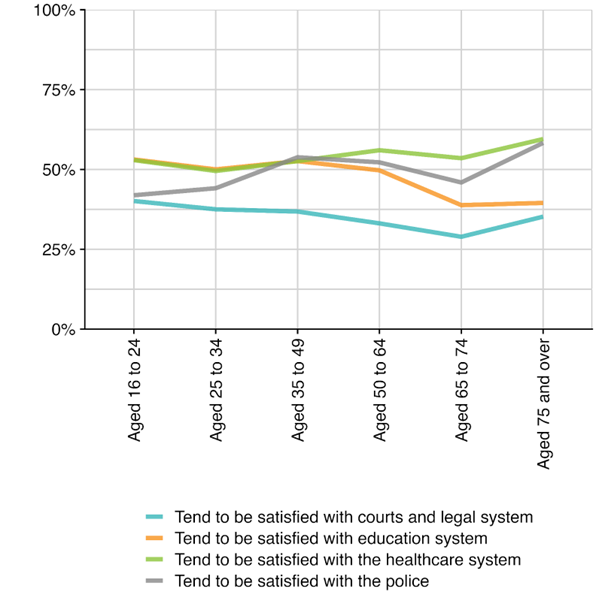
Fig 1. Percentage of individuals satisfied with services and systems across age groups, Q4 2023.
Social relationships and community
| Aspect of social life or place | Percentage |
|---|---|
| Social relationships | 84.2% fairly or very satisfied |
| Local community integration - people from different backgrounds get on well together in a local area. | 52.7% agree or strongly agree |
| Local area as a place to live | 82.2% fairly or very satisfied |
When it comes to differences based on age:
- Older people seem to be more satisfied with their social relationships and their local area as a place to live.
- Those aged 35-49 and those aged 75 and over were more likely to strongly agree or agree that different backgrounds get on well together in their local area.
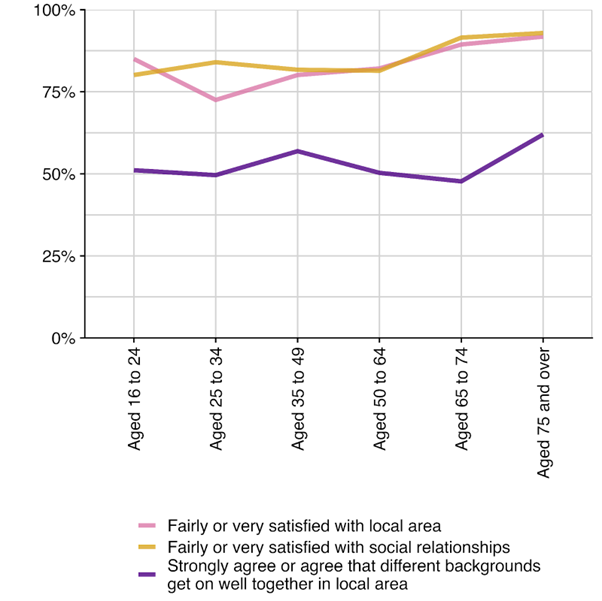
Fig 2. Percentage of individuals satisfied with social relationships and community across age groups, Q4 2023
Personal circumstances
| Aspect of personal life | Percentage who tend to be satisfied |
|---|---|
| Accommodation | 87.4% |
| Their education and skills | 75.0% |
| Main job | 73.0% |
| Health | 67.9% |
| How they spend their time in a typical week | 60.3% |
When it comes to differences in age:
- Older people seem to be more satisfied with accommodation, and how they spend their time.
- Adults nearing retirement were slightly more satisfied with their main job, and people in mid life were slightly more satisfied with their health than older or younger people.
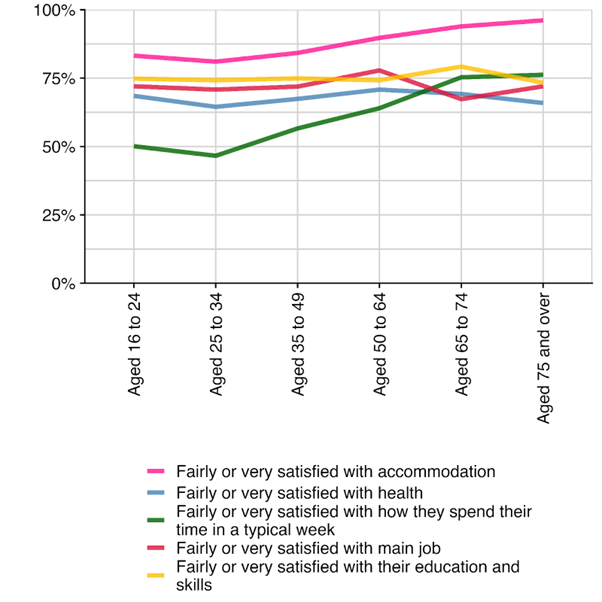
Fig 3. Percentage of individuals satisfied with various personal circumstances across age groups, Q4 2023
New measures by sex
- Females tend to be more satisfied than males when it comes to areas such as satisfaction with their education and skills or satisfaction with their relationships.
- Females were less satisfied than males when comparing satisfaction with public services, such as the courts and legal system.
- Little difference can be seen in satisfaction with the police, education or healthcare system, as well as personal areas such as their main job or own health.
- There is also very little gap between what males and females say about how different groups get on in their area.
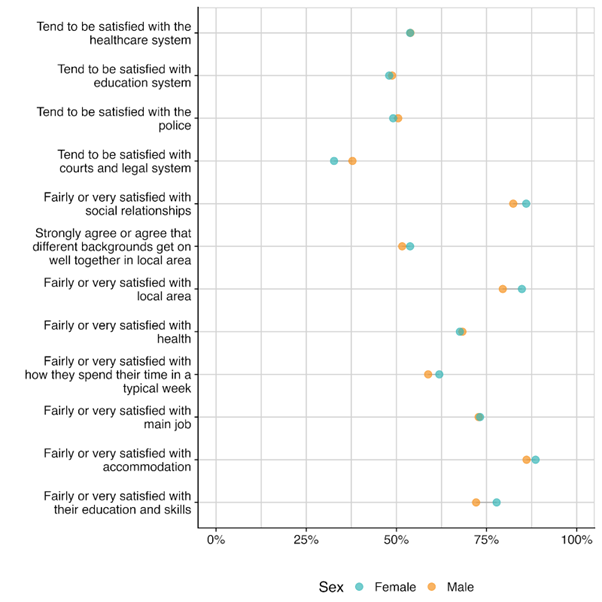
Fig 4. Percentage of individuals satisfied with various aspects of life across sex, Q4 2023
Insights from ONS4
Updates are published on the regularly collected measures of subjective wellbeing. These are known as the ONS4 and make up the dashboard’s ‘Personal well-being’ domain. The latest data is for Q3 of 2023.
Data reveals little change to most ONS4 measures from July to September 2023, compared to the previous quarter:
- Life satisfaction – 5.3% of UK adults rated their life satisfaction as low.
- Worthwhileness – 4% of UK adults rated ‘how worthwhile they feel the things they do in life are’ as low.
- Happiness – 8.5% of UK adults rated their happiness the previous day as low.
- Anxiety – 21.5% of UK adults rated their anxiety the previous day as high.
ONS4 trends over time
The ONS4 have been measured since 2011, allowing us to see trends over time. We can see changes during the pandemic, and a slight difference in 2023, which could correlate with the cost of living crisis.
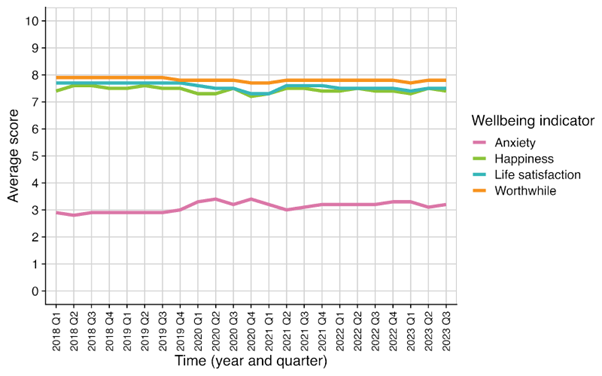
Fig 5. Average wellbeing scores across the quarters from 2018 to 2023. Note that high levels of anxiety are low levels of wellbeing. This graph shows the average score on a 0-10 scale.
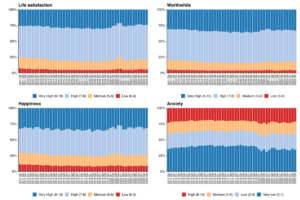
Fig 6. Percentage of respondents giving low to very high wellbeing scores across the quarters from 2011 to 2023. Note1high levels of anxiety are low levels of wellbeing (‘very low’ anxiety is a score of 0 to 1; ‘low’ anxiety is a score of 2 to 3; ‘medium’ anxiety is a score of 4 to 5; ‘high’ anxiety is 6 to 10). This graph shows the percentage of respondents giving high or low scores.
About ONS data
Quarterly data
The UK Measures of National Well-being Dashboard:
- Is updated and data is added each quarter.
- Uses 10 domains to assess whether people across the UK are living happy and fulfilling lives: Personal wellbeing, Relationships, Health, What we do, Where we live, Personal finance, Economy, Education and skills, Governance, and Environment.
- Each domain is underpinned by objective or subjective measures. For example, the ‘Health’ domain includes objective measures such as life expectancy, alongside self-reported measures such as perceptions of health.
See the dashboard for more details and information about the domains.
As well as comparing set time periods during the year, quarterly published data allows us to put subjective wellbeing data side by side with economic estimates, including GDP which is also released quarterly in the UK. The amount of data provided on different domains reflects different aspects of wellbeing. This can provide us with a greater breadth and depth of understanding about how we’re doing in the UK.
Annual data
Each year the ONS releases an annual account of wellbeing in the UK, which compiles data on the ONS4 at local authority level, and by characteristics and circumstances. Due to their size, these yearly updates provide large amounts of data which are robust, representative and generate longer term insights. For instance, they allow us to compare different regions in the UK each year or provide insights on the impact of significant events like the pandemic.
The last annual release was published on Tuesday 7 November 2023, covering the time period April 2022 to March 2023. We explored this data, comparing regions and yearly changes in a recent analysis.
Fortnightly data
For the most up-to-date indication of how we’re doing in the UK, the ONS releases a dataset every two weeks, on Public opinions and social trends, Great Britain: personal well-being and loneliness. It contains insights from the Opinions and Lifestyle Survey (OPN) reflecting the worries, personal wellbeing, and loneliness of adults in Great Britain, including ONS4 indicators. This helps us notice any short term changes or shocks, such as downward or upward scores, and reflect on why this might be. This may provide indications on the impact of seasonal changes, public holidays, or elections on wellbeing scores immediately afterwards.
Using national wellbeing data
Datasets from the ONS provide a bank of insights that allow us to look in detail at short- and long-term variations in wellbeing over time, and to compare different people’s experiences by socio-demographic characteristics, such as age or sex.
We can use this bank of insights to better understand how we’re doing as a nation, which can inform policy development at a local and national level.
What you can do:
- Explore the data further using the ONS interactive tool.
- Use these measures in your policy making in line with HM Treasury Green Book guidance. We have co-created free training for economists on implementing the recommendations of The Green Book and the supplementary guidance for wellbeing. Book our next training session on Thursday 18 April 2024, 09:30 – 13:30.
- Explore our report Wellbeing Evidence at the Heart of Policy for the big picture. It explains how a wellbeing approach can help inform, evaluate and drive decision making, whilst setting out the WISER policy priorities.
- Learn more about how we’re accelerating access to wellbeing datasets.
- See our work to maximise local area wellbeing for guidance and examples on how to use wellbeing data at a local government level.
Blog
![]()
[gravityform id=1 title=true description=true ajax=true tabindex=49]