Measuring progress and quality of life in the UK: November 2023
How are we doing in the UK?
Wellbeing data from the Office for National Statistics’ (ONS) UK Measures of National Well-being Dashboard (MNW) contain a wealth of information that helps us track national, community and personal wellbeing over time.
Here, we reflect on the ONS’ November 2023 quarterly and annual data releases to discover how we’re doing as a nation, including looking at insights from newly added measures, and exploring ways to use the data in practice.
The ONS’ UK Measures of National Well-being Dashboard is a framework that captures societal progress in the UK and tracks the future sustainability of national wellbeing.
It uses 10 domains to assess whether people across the UK are living happy and fulfilling lives:
- Personal wellbeing
- Relationships
- Health
- What we do
- Where we live
- Personal finance
- Economy
- Education and skills
- Governance
- Environment
The 10 domains are underpinned by objective and subjective measures. For example, the ‘Relationships’ domain includes subjective measures such as how happy people are with their relationships, if people feel they have someone in their lives to rely on, and how lonely they feel. The ‘Health’ domain includes objective measures such as life expectancy, alongside self-reported measures such as perceptions of health.
New measures
Following extensive public consultation, the MNW Dashboard was recently updated to capture additional dimensions of wellbeing through the development of 12 new measures. Data is now available in ONS’ latest release for five of these new metrics:
- Hope for the future
- Fair treatment
- Satisfaction with social relationships
- Satisfaction with time use
- Satisfaction with local area
The November 2023 release is part of a regular quarterly publication, which updates measures using the latest data available, making it a timely way to get a picture of how we’re doing.
To further understand what the newly added measures can tell us, we have examined trends and differences based on characteristics such as age and sex for September to October 2023 data.
Key insights by age
- Hope for the future – People aged 16 to 24 and those aged 65 to 74 are the most hopeful. Groups aged 50 to 64 seem to have the lowest levels of hope for the future.
- Fair treatment – Data shows those that feelings of being treated unfairly by society are the highest for people aged between 35 and 64. In comparison, older people over 65 are less likely to feel unfairly treated.
- Satisfaction with social relationships – Trends show the oldest and youngest groups are the most satisfied with their social relationships.
- Satisfaction with time use – With the exception of the youngest age bracket, this data indicates that the older you are, the more satisfied you are with how you use your time during a typical week.
- Satisfaction with local area – Satisfaction with your local area as a place to live seems to increase with age, and is lowest for two age brackets between 16 and 34.
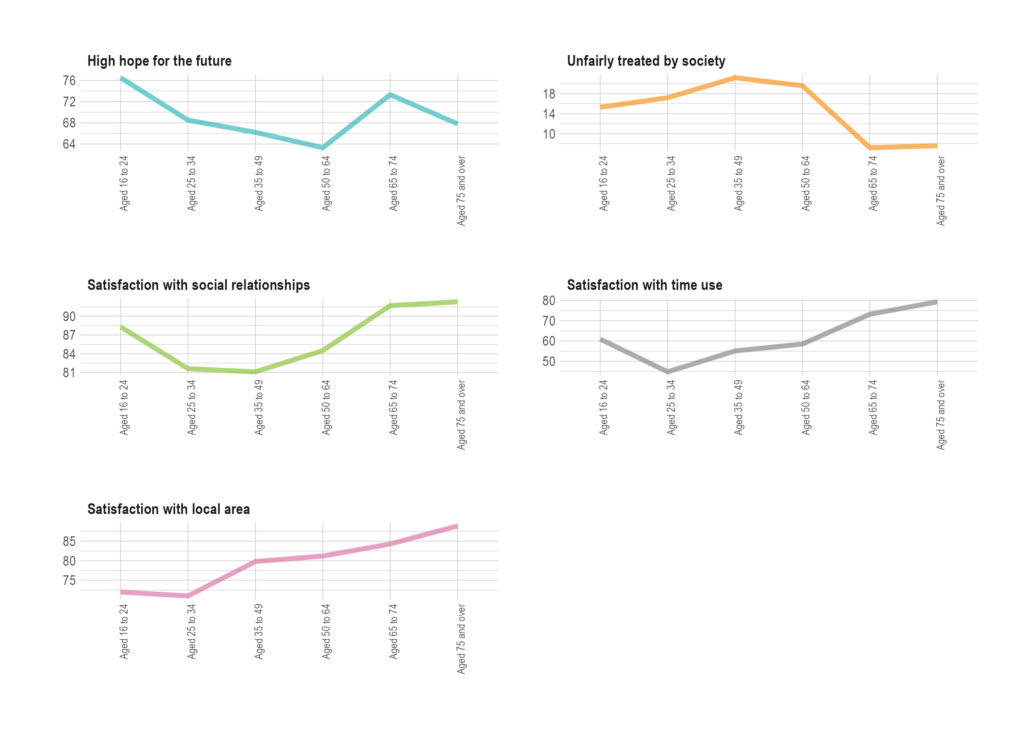
Fig 1. New wellbeing trends by age cohort, Q2 20231Source: Office for National Statistics (ONS), UK Measures of National Well-being Dashboard
Key insights by sex
- Hope for the future – Females are more hopeful for the future than males.
- Satisfaction with time use – Females are more satisfied with how they spend their time in a typical week.
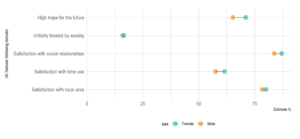
Fig 2 New indicators added to the UK National Well-being Framework, Q2 2023 and 20 Sept – 1 Oct 2023. Data for indicators refer to the period between 20 September to 1 October 2023. 2Source: Office for National Statistics (ONS), UK Measures of National Well-being Dashboard
As more data is collected and released, we will be able to track these measures over time and observe any changes or trends.
Subjective wellbeing – ONS4
Alongside the new metrics, updates were published on the regularly collected measures of subjective wellbeing: life satisfaction, worthwhile, happiness and anxiety. These are known as the ONS4 and make up the dashboard’s ‘Personal well-being’ domain .
Low rates of life satisfaction, worthwhileness or happiness are determined when people score themselves very low between 0 – 4, on an overall scale of 0 – 10.
Data from April to June 2023 reveal little change to most ONS4 measures in the short and long term:
- Life satisfaction – 5.1% of UK adults rated their life satisfaction as low.
- Worthwhileness – 3.9% of UK adults rated ‘how worthwhile they feel the things they do in life are’ as low.
- Happiness – 8.2% of UK adults rated their happiness the previous day as low.
- Anxiety – 22.5% of UK adults rated their anxiety the previous day as high. This shows no change in the short term, with a similar 22.9% in April to June 2022, but data suggests an increase in anxiety in the long term, as rates from April to June 2018 were 19.5%.
Key insights by age
We broke down this data by age, and the trends we found suggest:
- There are peaks of low life satisfaction, low worthwhileness, low happiness and high anxiety in middle age, particularly between the ages of 45 to 49.
- Those aged under 25 experience higher anxiety and are also less likely to feel that what they do in life is worthwhile.
- Groups aged over 85 see a spike in people experiencing low happiness, low worthwhileness and low life satisfaction. This is consistent with previous analysis from 2019 and 2020.
The data available for some age groups is likely to be smaller than others, in particular for older groups, so we should be cautious about making any definite conclusions.
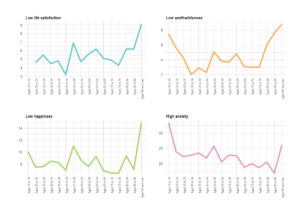
Fig 3. Personal wellbeing trends by age cohort, Q2 2023 3Source: Office for National Statistics (ONS), UK Measures of National Well-being Dashboard
Key insights by sex
Breaking down ONS4 data by sex revealed some differences between males and females. In particular, we saw a gap in levels of anxiety, with females reporting higher anxiety than males between April to June 2023. This is consistent with previous trends.
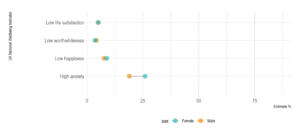
Fig 4. Personal wellbeing indicators, Q2 2023 and 20 Sept – 1 Oct 2023. 4Note: Data for low life satisfaction, low worthwhileness, low happiness and high anxiety refer to Q2 2023. 5Source: Office for National Statistics (ONS), UK Measures of National Well-being Dashboard.
Annual data
Each year the ONS releases an annual account of wellbeing in the UK. It compiles data on the ONS4 at local authority level, and by characteristics and circumstances. Due to their size, these yearly updates provide large amounts of data which are robust and representative. On Tuesday 7 November ONS published their latest version, Personal well-being in the UK: April 2022 to March 2023.
This annual data provides additional longer term insights.
When looking at subjective wellbeing, trends indicate regional variations with a statistically significant decline in average ratings of life satisfaction:
- North West – 0.11 point decrease.
- Yorkshire and The Humber – 0.15 point decrease.
- East Midlands – 0.15 point decrease.
- East of England – 0.15 point decrease.
The average ratings for the year ending March 2023 remain below pre-pandemic levels. The proportion of people reporting low wellbeing across the four measures is higher than pre-pandemic levels in 2019. Poor health contributes negatively to all measures and relationship breakdown contributes to lower life satisfaction.
| Average 2023 (scores out of 10) | Average 2022 (scores out of 10) | Proportion with low wellbeing 2023 | Proportion with low wellbeing 2022 | |
|---|---|---|---|---|
| Life satisfaction | 7.45 | 7.54 | 5.7% | 5.1% |
| Worthwhile | 7.73 | 7.77 | 4.5% | 4.1% |
| Happiness | 7.39 | 7.45 | 8.9% | 8.5% |
| Anxiety | 3.23 | 3.12 | 23.4% | 22.5% |
Explore the dashboard, to see all the measures and the latest data.
Using the data
We support the appropriate and consistent use of harmonised measures to understand national wellbeing and continue to use the growing and rich data provided by the ONS in our analysis and research.
ONS data allows us to look in detail at short and long term variations in wellbeing over time and compare different time periods. We can separate the data by characteristics, such as age or sex, to note any differences. We can also put subjective wellbeing data side by side with economic estimates, to see how they relate to one another; for instance GDP, which is also released quarterly.
We can use the data in:
- Analysis – accelerating access to wellbeing datasets.
- Policy development – HMT Green Book wellbeing supplementary guidance.
- Decision making – using wellbeing evidence.
- Local authority and public health – local area use of wellbeing data.
Blog
![]()
[gravityform id=1 title=true description=true ajax=true tabindex=49]