Measuring progress and quality of life in the UK: May 2023
National Wellbeing is ‘How we’re doing as individuals, communities and as a nation and how sustainable it is for the future’.
As a Centre we support the appropriate and consistent use of harmonised measures to understand national wellbeing.
Here, we look at the Office for National Statistics’ (ONS) most recent Measures of National Well-being Dashboard: Quality of Life in the UK quarterly publication and discuss what the latest release tells us about wellbeing in the UK.
What does the release cover?
The Office for National Statistics’ (ONS) 12 May 2023 release gives an update on 22 of the 44 indicators across 10 domains of national wellbeing, using the latest data available as of 27 April 2023.
The ONS uses objective and subjective measures as part of the wellbeing framework to measure societal progress in the UK and track the future sustainability of national wellbeing.
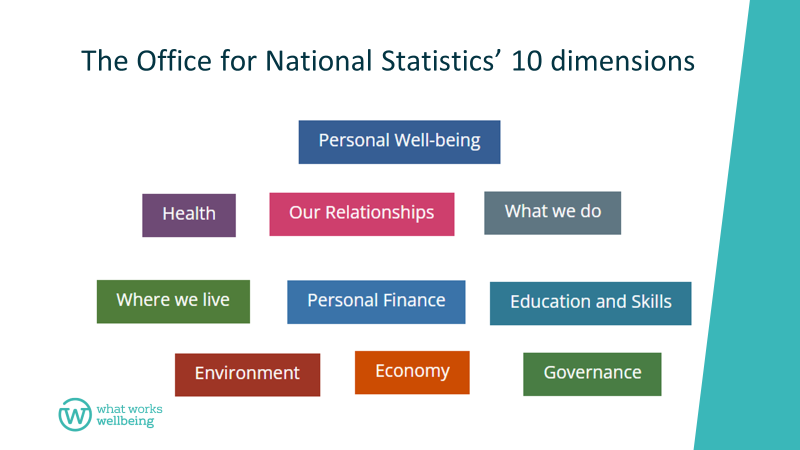
The 10 domains are indicators of whether people across the UK are living happy and fulfilling lives:
The national wellbeing indicators come from several data sources with different geographical coverage and data collection periods. Access the data set.
The latest quarterly release covers subjective wellbeing and its drivers, alongside economic, environmental and governance indicators to show the full picture of our national accounts.
Subjective wellbeing
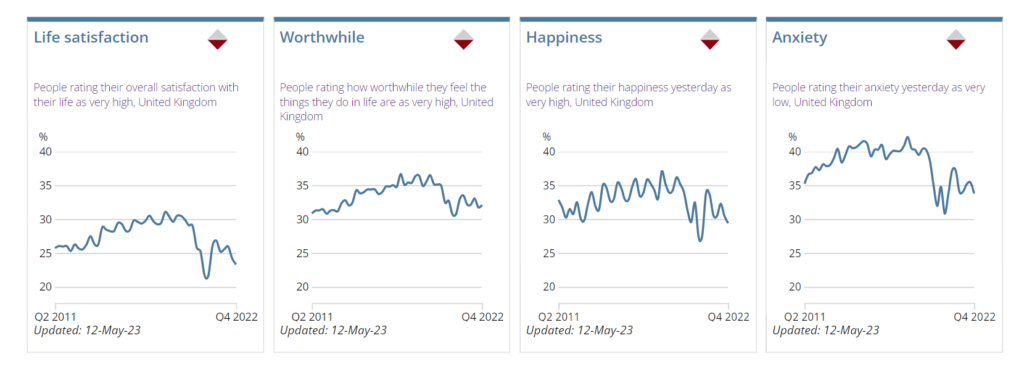
The latest publication includes insights from the four indicators of individual subjective wellbeing (ONS4) for October to December (Q4) 2022:
- Life satisfaction – 23.3% of adults in the UK reported very high levels of life satisfaction. This has decreased compared with 25.2% in Q4 2021.
- Sense of worthwhile – 32.09% of adults in the UK reported very high levels of feeling things they do in life are worthwhile. This remained stable compared with 32.15% in Quarter 4 2021.
- Happiness – 29.38% of adults in the UK reported very high levels of happiness. This has slightly decreased compared with 30.57% in Q4 2021.
- Anxiety – 33.80% of adults in the UK reported very low levels of anxiety. This has decreased compared with 34.06% in Q4 2021.
Population anxiety is still higher than it was pre-pandemic. Before 2020 most age groups had seen improvement in all of the measures except for anxiety in under 24 year olds. In march 2020 anxiety rapidly accelerated for all ages. Now anxiety is higher on average for the whole population and is now largely driven by those of working age.
In other measures the distribution has shifted downwards with fewer reporting very high levels of life satisfaction and happiness. Feeling that what we do in life has moved least over the last few years.
To see how these national subjective wellbeing measures have been used in practice, and the types of interventions aimed at improving their measured outcomes, see our rapid evidence assessment of impact evaluations. This was the first review of its kind and part of our work to systematically identify and summarise evidence from evaluations that use the standardised ONS4 measures.
Further insights on the drivers of wellbeing
Health
44.7% of adults in the UK were mostly or completely satisfied with their health between January 2020 and December 2021. This has decreased from 51.3% in 2015-16.
Relationships
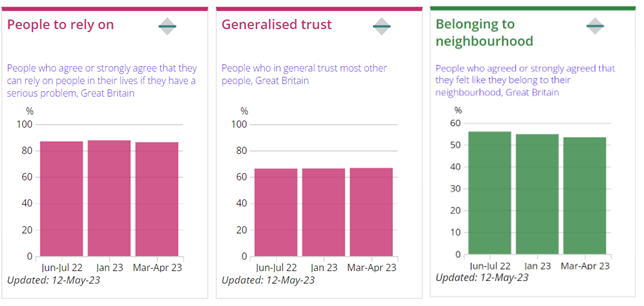
Between 22 March and 16 April 2023:
- 66.8% of UK adults said that, in general, they trust most people. This is similar to January 2023 (66.4%).
- 87.7% of UK adults reported that they can rely on people in their lives if they have a serious problem. This is slightly higher than in January 2023 (86.3%).
- 53.4% of UK adults agreed or strongly agreed that they felt like they belong to their neighbourhood. This is slightly lower than January 2023 (54.8%).
Having someone to rely on and levels of trust are two of the six indicators of high wellbeing nations.
To build the evidence base on community wellbeing and social capital we brought together what is known about improving neighbourhood belonging, social support and community cohesion in a rapid evidence review. The review also promotes the use of harmonised social capital measures to ensure wellbeing evidence is increasingly consistent, robust and useful.
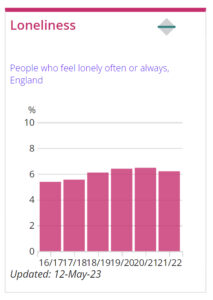
In England, 6.2% of people aged 16 and over reported feeling lonely often or always 2020-2021. We know that loneliness has negative impacts on how we feel about ourselves and people around us and it can have harmful effects on our physical and mental health.
Together with the Campaign to End Loneliness, and funded by DCMS Tackling Loneliness Team, we are reviewing the evidence on loneliness alleviation and mapping current practices in the field. We are also working with academics at Glasgow University to explore social isolation and loneliness across the life course.
Employment
The Unemployment rate was 3.8% for December 2022 to February 2023, with no short term change from September to November 2022.
Between October and December (Q4) 2022, 11.5% of 16 to 24 year olds were not in education, employment or training. This is marginally higher than the previous quarter (10% July to September 2022).
From our systematic review on unemployment we know that being out of work is damaging to people’s wellbeing regardless of their age, gender, level of education, ethnicity or part of the country in which they live. The longer the time unemployed, the worse the effect.
Watch our latest Business Leaders’ Council webinar to explore how employers and policymakers can support people to find and keep work across the life course to ensure the sustainability of the UK workforce.
Volunteering
34.1% of adults in Great Britain reported giving unpaid help to clubs, groups, charities, or organisations in the last 12 months. Of those, 57.4% reported volunteering at least once a month.
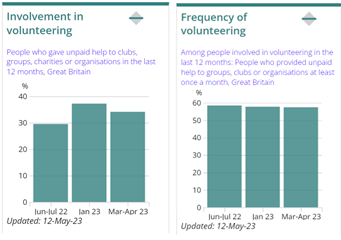
Our review of volunteering evidence found that volunteering is associated with enhanced wellbeing, including improved life satisfaction, increased happiness and decreases in symptoms of depression.
Although the ONS’ latest statistics echo findings from the Community Life Survey and NCVO that the number of people volunteering is still low compared to pre-pandemic levels, it also shows that numbers may be picking up slowly. Future releases will say whether the sectors’ big recruitment drive campaigns like the Big Help Out have made a difference in the numbers.
Arts, culture and sport
Participation in art, culture and sport has increased.
Between October and December (Q4) 2022, 89.6% of UK adults reported engaging with the arts in person in the last 12 months. This represents an increase from the previous year (86.8%).
In 2021-2022, 63.1% of UK adults reported participating in moderate-intensity sport and/or physical activity for at least 150 minutes a week. This is an improvement from both short and long term.
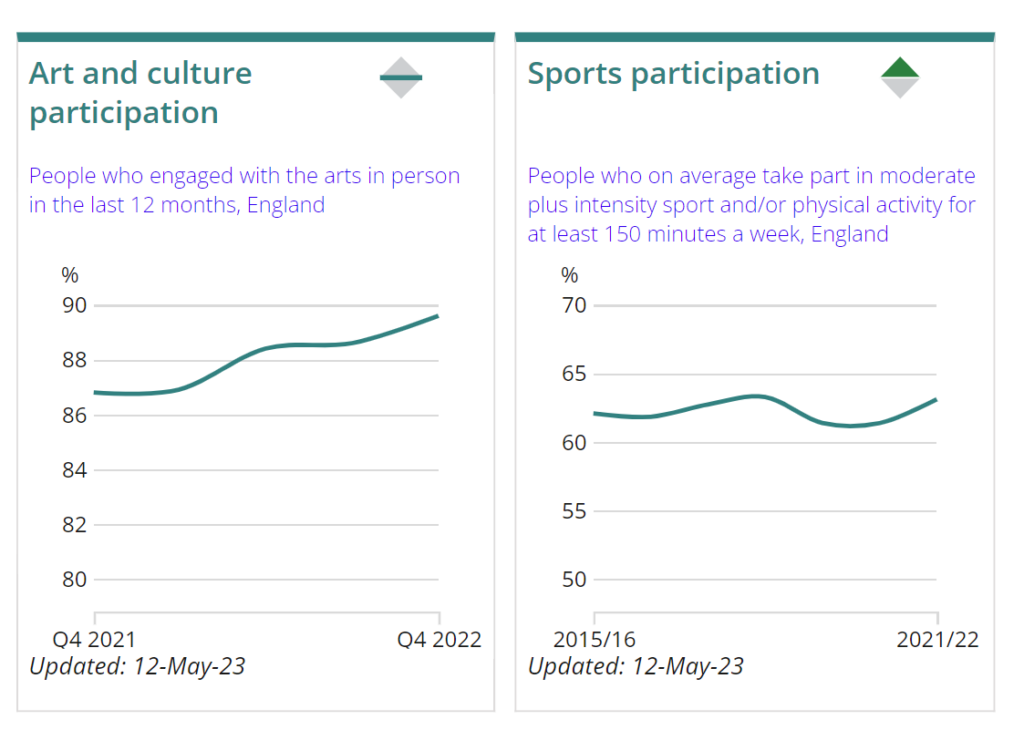
We know from analysis that:
- Physical activity improves feelings of happiness and purpose at the time and contribute to physical health which improves life satisfaction over longer timescales.
- Culture participation can be negative for purpose (although we were surprised by improvements in the Carers Music Fund) but can be very high for happiness.
Explore the evidence on the wellbeing impact of culture and sports, including our review of placed-based arts and events, Mental Wellbeing WEWMBS interventions.
Using the quarterly data
By using the quarterly data, we can look in more detail at the short and long-term variations in subjective wellbeing by time and by age group. We can also compare quarters within a year and across years, to give us a clearer picture beyond national yearly averages. We can also compare the subjective wellbeing data with economic wellbeing estimates, such as GDP, which use quarterly data for their indicators.
What you can do:
- Explore the data further using the ONS interactive tool.
- Use these measures in your policy making in line with HM Treasury Green Book guidance and look for our future training opportunities.
- Explore Wellbeing Evidence at the Heart of Policy for the big picture.
- Read Paul Allin’s discussion paper on The role and use of official statistics in measuring wellbeing.
- Learn more about how we’re accelerating access to wellbeing datasets.
- See our work to maximise local area wellbeing for guidance and examples on how to use wellbeing data at a local government level.
Reviewing the framework
On 3 October 2022, ONS launched a review of the Office for National Statistics’ Measures of National Well-being. The recommendations from this consultation will be published in July 2023. See the Response summary: Review of the Measures of National Well-being for more information.
Blog
![]()
[gravityform id=1 title=true description=true ajax=true tabindex=49]